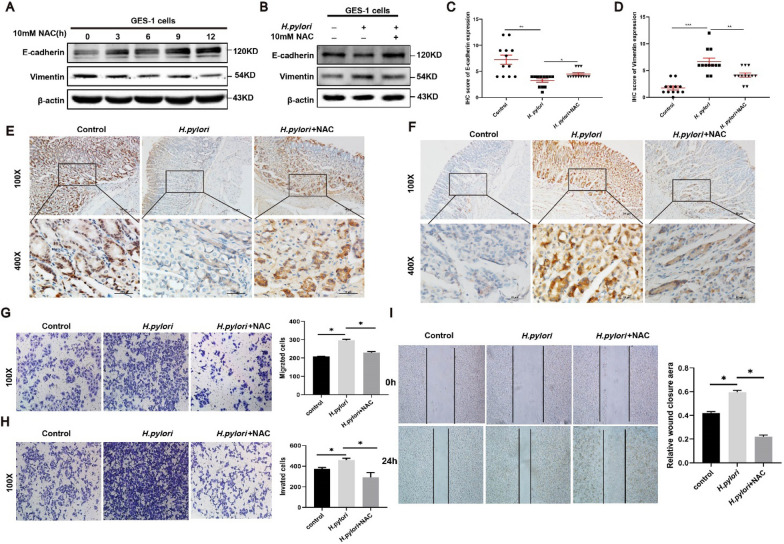
Fig. 6.
| ROS mediates cell proliferation and the EMT phenotype induced by H. pylori in GC cells. A The protein levels of β-actin, Vimentin, and E-cadherin were detected in AGS cells treated with NAC (10 mmol/L) for different periods of time (0 h, 3 h, 6 h, 9 h, and 12 h). The data is representative of 3 independent experiments. B Western blot analysis of β-actin, Vimentin, and E-cadherin in AGS cells with control group, infection of wild-type H. pylori strain PMSS1 (MOI = 200) for 12 h, and combination treatment of wild-type H. pylori strain PMSS1 (MOI = 200) and NAC (10 mmol/L) for 12 h. The data is representative of 3 independent experiments. C, D The IHC scores were evaluated and statistically compared for expression of E-cadherin and vimentin. E, F Representative images of IHC staining for E-cadherin and vimentin in Balb/c mice gastric tissues with control group (n = 10), H. pylori strain SS1 group (n = 10), and combination of H. pylori strain SS1 and NAC group (n = 10). (Magnification 100 × , and 400 × ; bars = 5 μm). G The migration assays were conducted in AGS cells with control, H. pylori, and combination treatment of NAC (10 mmol/L) and H. pylori groups for 12 h, positively stained cells were counted and summarized in the statistical graph. The data is representative of 3 independent experiments. (magnification × 100). H The invasion assays were conducted in AGS cells with control, H. pylori, and combination treatment of NAC (10 mmol/L) and H. pylori groups for 12 h, positively stained cells were counted and summarized in the statistical graph. The data is representative of 3 independent experiments. (magnification × 100). *p < 0.05. I The wound healing assays were conducted in AGS cells with control, H. pylori, and combination treatment of NAC (10 mmol/L) and H. pylori groups for 12 h. The scratch width was captured at 0 and 48 h after the scratch, the relative wound closure area was summarized in the statistical graph. The data is representative of 3 independent experiments. (magnification × 100). *p < 0.05, **p < 0.01, ***p < 0.001

