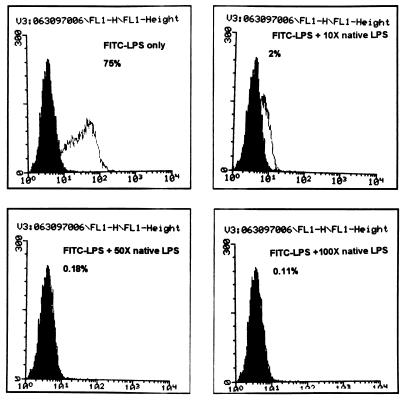
FIG. 7.
Competition of FITC-LPS binding to CHO/rCD14 cells by excess of native-form LPS. The binding buffer is PBS with 10% CS and 0.1% sodium azide. The fold excess of native-form LPS added in the binding buffer and the respective percentage of FITC-positive cells are shown. The open histogram represents the FITC-LPS staining. x axis, log fluorescence intensity; y axis, cell number. The data are representative of three independent experiments.

