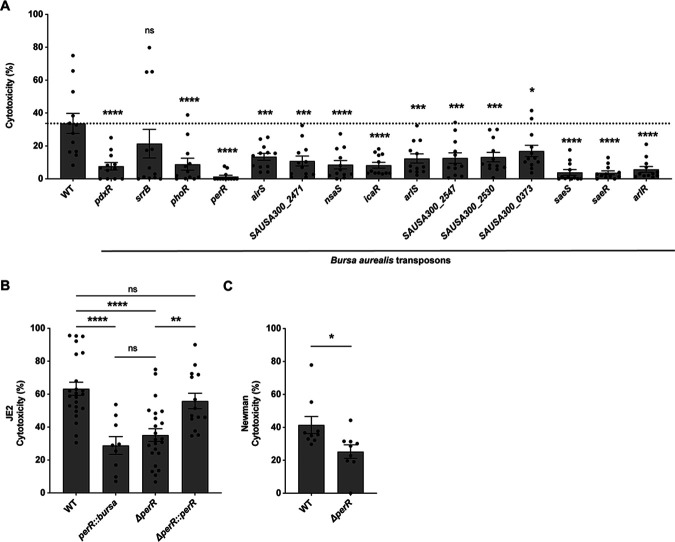
Fig 3.
Decreased hPMN cytotoxicity of potential lukAB activator mutants. (A) Cytotoxicity values of selected PlukAB activators. Cytotoxicity was measured as percent lactate dehydrogenase (LDH) release from lysed hPMNs. The results shown are from two independent experiments each performed with three colonies of each strain repeated in four blood donors (n = 12, MOI = 8). The dotted line represents wild-type JE2. Statistical analysis was performed using one-way ANOVA with multiple comparisons to determine the statistical significance of mutants compared to wild-type JE2. Error bars indicate SEM. (B) Cytotoxicity of strains wild-type JE2, perR::bursa, ΔperR, and the complement strain (ΔperR::perR). The values are averages of eight independent experiments with two colonies of each strain repeated in 23 blood donors (n = 18–46, MOI = 18). The increase in MOI was used to induce increased cytotoxicity. Statistical analysis was performed using one-way ANOVA with multiple comparisons to determine the statistical significance of mutants compared to wild-type JE2. Error bars indicate SEM. (C) Cytotoxicity of Newman wild-type and ΔperR. The results shown are averages from three independent experiments with two colonies of each strain repeated in nine blood donors (n = 18, MOI = 18). Statistical analysis was performed using an unpaired t-test with Welch’s correction to determine the statistical significance of mutants compared to wild-type JE2. Error bars indicate SEM. *P ≤ 0.05; **P ≤ 0.01; ***P ≤ 0.001; ****P ≤ 0.0001.

