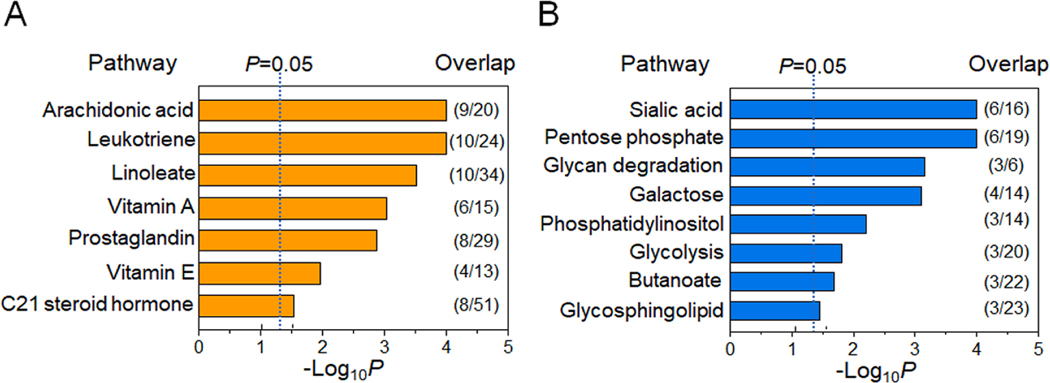
Fig. 4.
Metabolic pathway associated with T3 chemicals. Pathway enrichment analysis with metabolites of two network communities in Fig. 3 was conducted using mummichog. A) Seven pathways were found altered with F18 chemical in C1and B) eight pathways were altered with chemicals (F19-F21) in C2 (p < 0.05). The ratio of selected metabolites mapped to the listed pathway over the number of total pathway metabolites detected is provided to the right of each bar.

