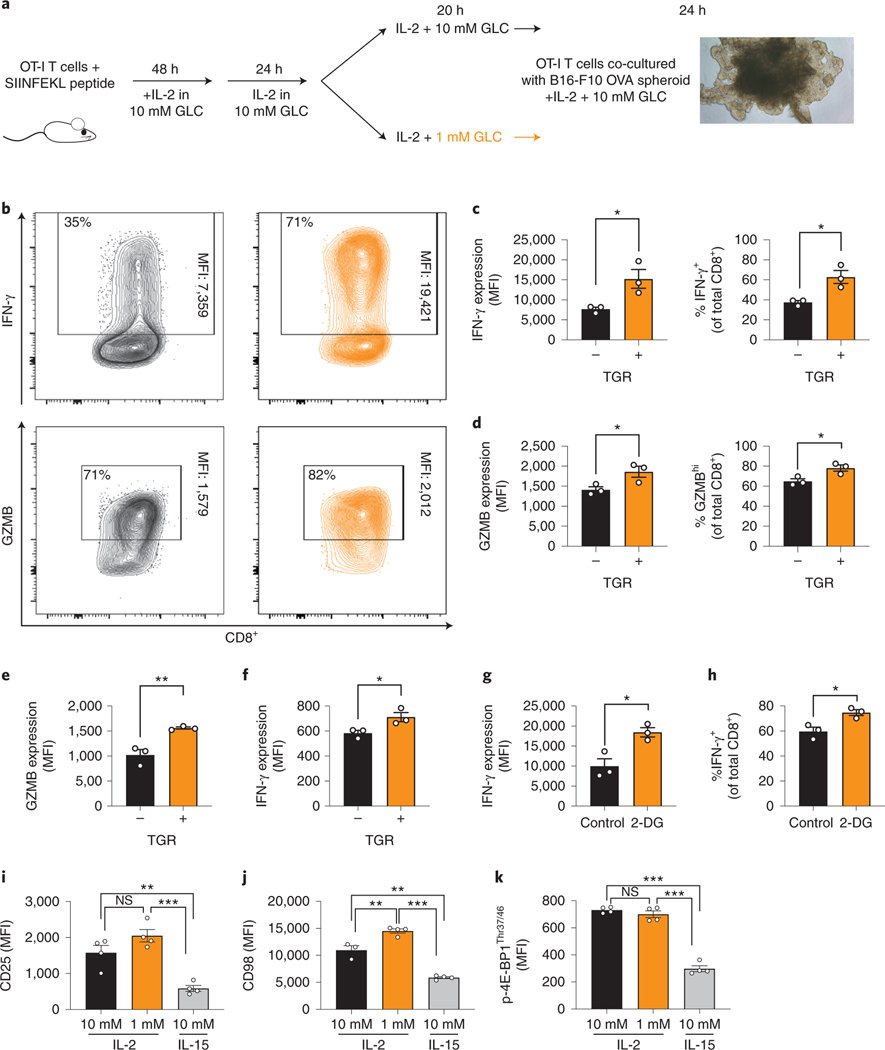
Fig. 1. TGR enhances CD8+ TE effector molecule expression upon glucose re-exposure.
(a) To generate OVA-specific CD8+ TE, OT-I splenocytes were activated with SIINFEKL peptide and IL-2 (100 U/mL), expanded for 72 hours total, followed by 20 hours of exposure to 10mM (control, black) or 1mM (TGR, orange) glucose in cultures set to 1 million per ml. B16-F10-OVA cells were established as multicellular spheroids for 8 days. (b) 100.000 OT-I TE cells generated as in (a) were combined with spheroid cultures in refreshed media containing 10mM glucose and IL-2, co-cultured for 20 hours, treated with brefeldin-A and assessed for intracellular cytokine expression induced by tumor-expressed antigen. Representative scatter plots are shown. (c-d) Quantification of IFN-γ and GZMB per cell (MFI, left) and number of IFN-γ+ or GZMBhi cells (right). Points represent averaged data from 4 independent co-cultures. data shown for 3 biological replicates. Statistical significance was calculated by 2-tailed Student’s t test. * p<0.05. (e-k) WT CD8+ T cells isolated from spleens of C7Bl/6 mice were activated with anti-CD3 (5 mg/mL), anti-CD28 (0.5 mg/mL), IL-2 (100 U/mL), expanded for a total of 72 hours, to 10mM (control, black) or 1mM (TGR, orange) glucose in cultures set to 1 million per ml. (e-f) Cells were restimulated using PMA/ionomycin with brefeldin-A and assessed for intracellular levels of (e) GZMB and (f) IFN-γ. Data show 3 biological replicates and are representative of 3 independent experiments. Statistical significance was calculated by 2-tailed Student’s t test. * p<0.05, ** p<0.01. (g-h) WT CD8+ T were isolated, activated and expanded as in (e-f), and exposed to 2-deoxy-glucose (2-DG, 0.5mM) for 20h. 2-DG was removed, cell were restimulated as above and assessed for intracellular (g) IFN-γ expression and (h) number of IFN-γ+ cells. Data show 3 biological replicates and statistical significance was calculated by 2-tailed Student’s t test. * p<0.05. (i-k) WT CD8+ T cells activated and starved as in (e,f) or exposed to 100u IL-15 for 20h. Expression of (i) CD25, (j) CD98 and (k) p-4E-BP1Thr37/46 were assessed. Data show n=4 biological replicates. Statistical significance was calculated by 2-tailed Student’s t test. * p<0.05; ** p<0.01; *** p<0.001. All error bars show SEM.

