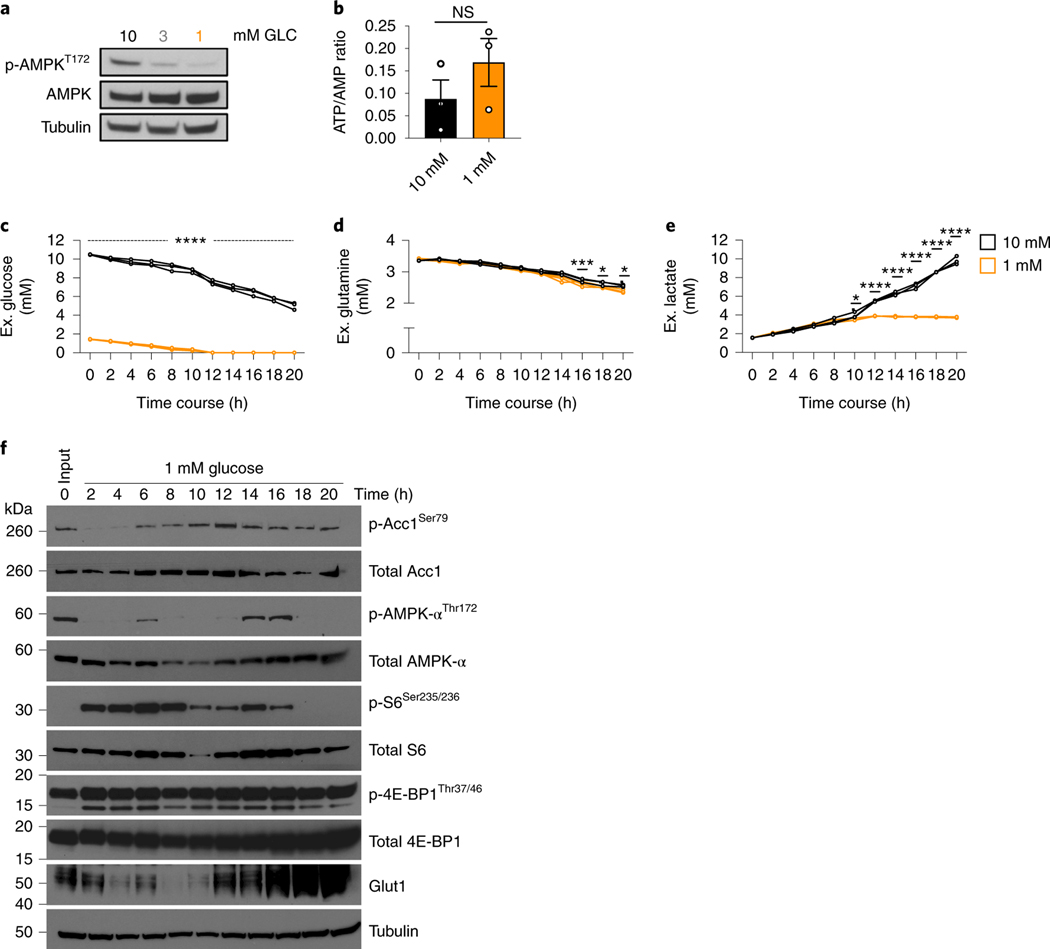
Fig. 3. TGR CD8+ TE are metabolically active and energetically balanced.
(a-f) WT CD8+ T cells isolated from spleens of C7Bl/6 mice were activated with anti-CD3 (5 mg/mL), anti-CD28 (0.5 mg/mL), IL-2 (100 U/mL), expanded for a total of 72 hours, and exposed to 10mM (black) or 1mM (orange) glucose in cultures set to 1 million per ml. (a) Immunoblot analysis of protein extracts from equal cell numbers probed for phosphorylated AMPK at Thr172 (p-AMPkThr172) and total AMPK. Tubulin was used as a loading control. Data are representative of 3 independent experiments, and 4 biological replicates. (b) Polar metabolites were extracted, levels of ATP (a.u.) and AMP (a.u.) were measured by liquid-chromatography mass spectrometry and ratios (a.u.) were calculated for 3 independent biological replicates. No significant differences were observed using a 2-tailed Student’s t test. Representative of 2 independent experiments. (c-e) Media samples and (f) protein isolates were collected every 2h over the 20h exposure to limiting glucose concentrations. Changes in media (c) glucose, (d) glutamine, and (e) lactate concentration were measured over the 20h timecourse using a Cedex Bio Analyzer. Statistical significance was calculated from 3 biological replicates using 2way ANOVA. * p<0.05; *** p<0.001; ****p<0.0001. (f) Immunoblot analysis of protein extracts from equal cell numbers probed for phosphorylated acetyl-coA carboxylase at Ser79 (p-ACC1Thr79), total ACC1, phosphorylated AMPK at Thr172 (p-AMPkThr172), total AMPK, phosphorylated ribosomal protein S6 at Ser235/236 (p-S6Ser235/236), total S6, phosphorylated 4E-binding protein 1 at Thr37/46 (p-4E-BP1Thr37/46), total 4E-BP1, and Glut1. Tubulin was used as a loading control. Optical density was measured and changes in phosphorylation are shown relative to total protein and as direct measurements. Representative of 3 biological independent samples. Biological replicate data is shown in Extended Data Fig. 3. All error bars show SEM.

