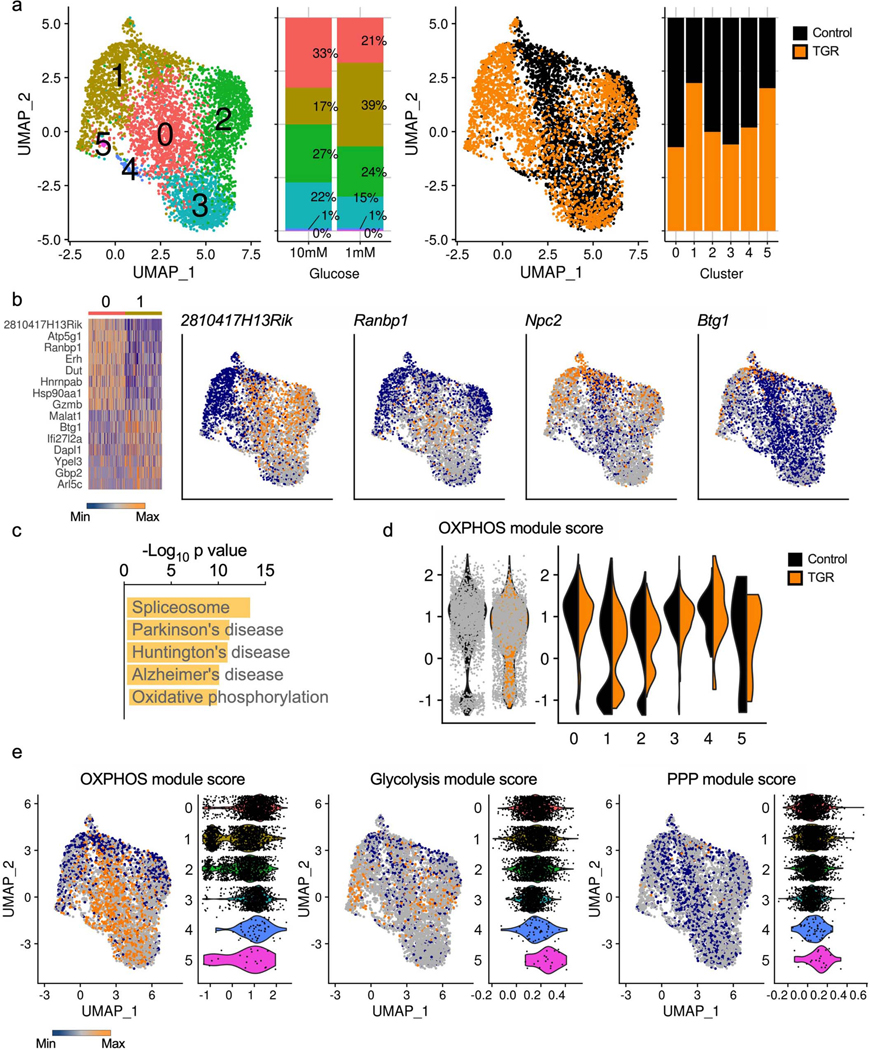
Extended Data Fig. 2. Limited transcriptional reprogramming during TGR.

WT CD8+ T cells isolated from spleens of C7Bl/6 mice were activated with anti-CD3 (5 mg/mL), anti-CD28 (0.5 mg/mL), IL-2 (100 U/mL), expanded for a total of 72 hours, and exposed to 10mM (black) or 1mM (orange) glucose in cultures set to 1 million per ml. RNA isolated from single cells was sequenced using the 10X genomics platform and analyzed to explore transcriptional changes in each population of cells. (a) A Uniform Manifold Approximation and Projection (UMAP) of the overlapped cells from each treatment (control, black; TGR, orange), clustered on the basis of transcriptional similarity is shown highlighting clusters and treatment distribution. Bar graphs depicting cluster distribution for each condition are also shown. (b) Clusters 0 and 1, where least overlap between treatments was observed, were contrasted to look for differentially expressed genes (> 1.2-fold change and < 0.1 adjusted p-value); a heatmap of top up and down regulated genes is shown, along with UMAPs of example genes. (c) The top 5 most enriched pathways in differentially regulated genes between cluster 0 and 1. (d) Module scores based on average expression levels of gene programs were calculated for 18 differentially expressed OXPHOS genes (Atp5g1, Atp5g3, Cox5a, Cox6a1, Cyc1, Ndufa11, Ndufa12, Ndufa4, Ndufa8, Ndufabl, Ndufb7, Ndufb8, Ndufcl, Ndufc2, Ndufs6, Sdhb, Uqcr10, Uqcr11). Violin plots depict the global OXPHOS module score per condition (left) or per cluster and condition (right). (e) Module scores based on average expression levels of gene programs were also calculated for enzyme-coding genes involved in glycolysis (mmu00010) or the pentose phosphate pathway (PPP, mmu00030) based on Kegg annotation. UMAP and Violin plots illustrate the OXPHOS, glycolysis and PPP modules, with the violin plots divided per cluster.
