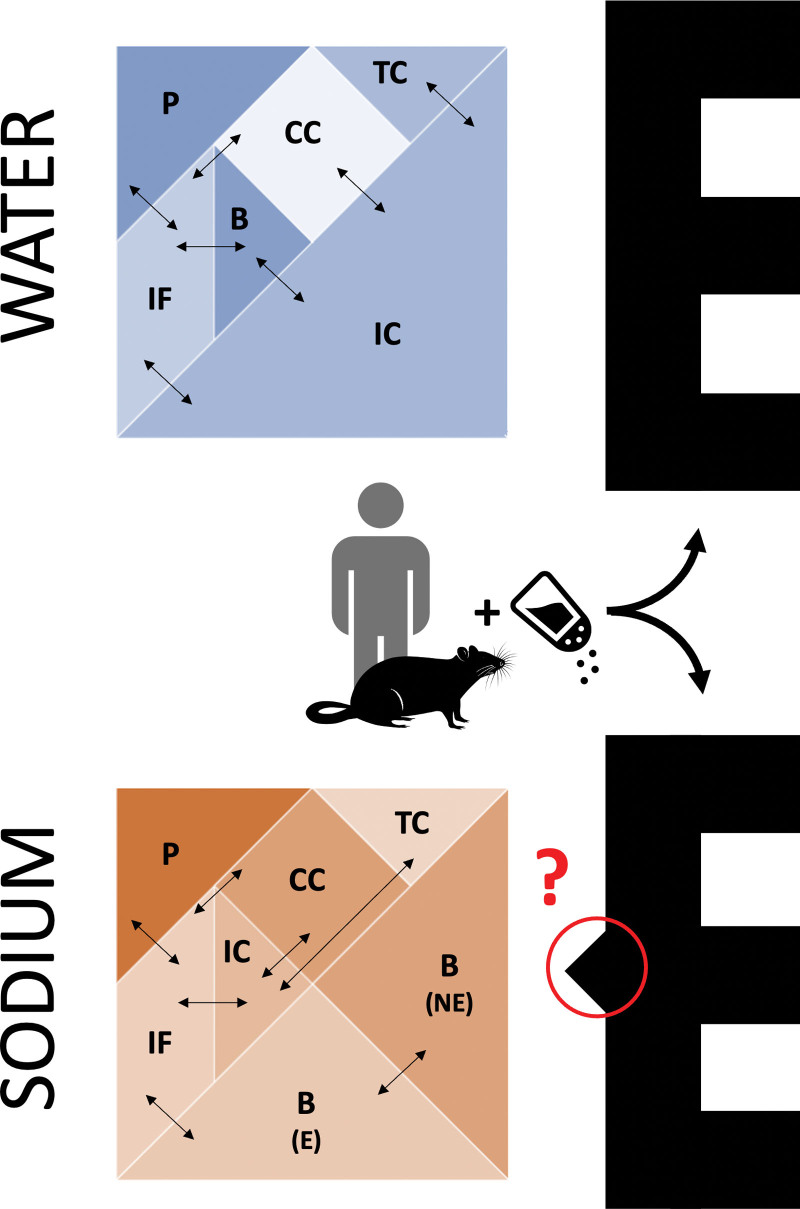
Figure 1.
The Tangram of water and sodium. The Tangram shapes (left) depict the traditional distribution of body water and sodium in compartments.20 Experimental salt loading of humans and rats led to a puzzling excess of sodium compared with water,13–17 which reminds of Tangram paradoxes (E shapes): 2 figures composed with the same 7 pieces, one of which incomprehensibly seems to be a subset of the other (solution shown in Figure S3). B indicates bone; CC, dense connective tissue and cartilage; E, exchangeable fraction; IC, intracellular; IF, interstitial/lymphatic fluid; NE, nonexchangeable fraction; P, plasma; and TC, transcellular.

