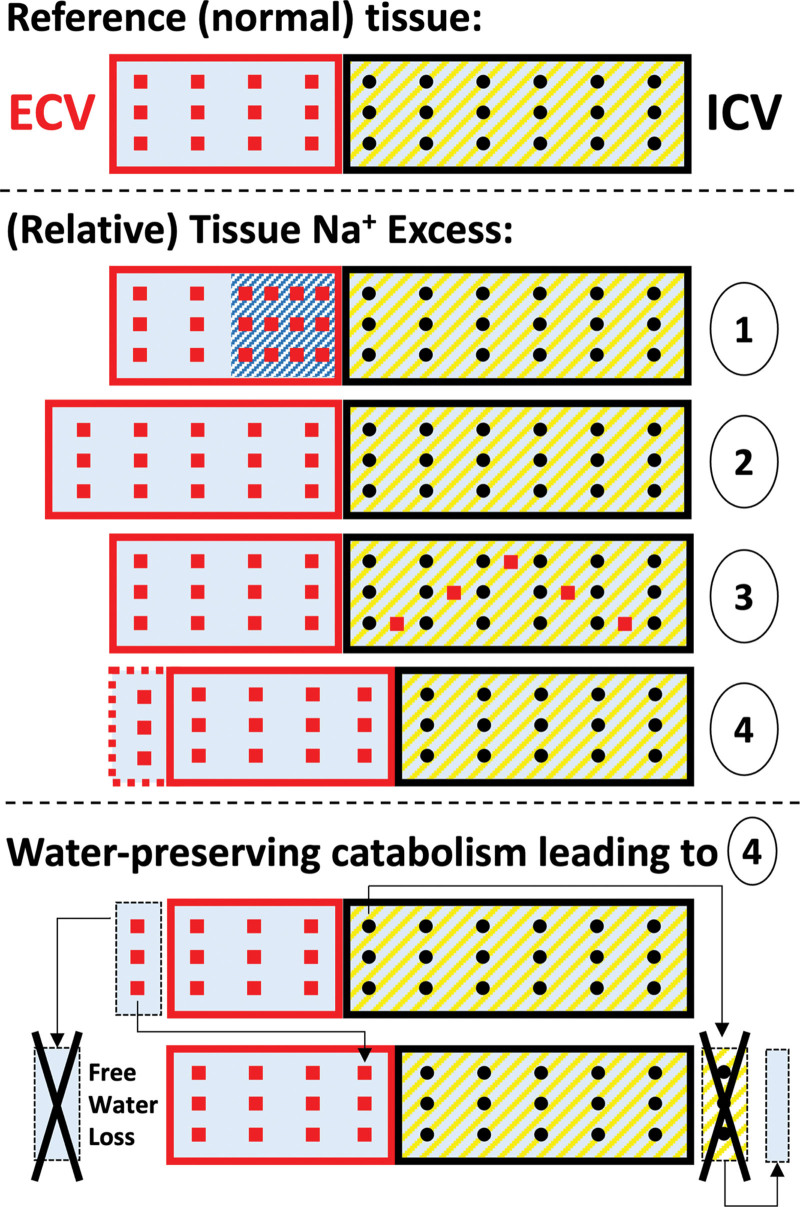
Figure 3.
Reappraisal of the Tangram for interpretation of tissue Na excess. Top, Physiological reference tissue, composed of extracellular and intracellular volumes (ECV and ICV), rich in Na+ (squares) and K+ (dots), respectively. Middle, Different pathophysiological patterns resulting, at whole-tissue analysis (eg, in 23NaMRI), in tissue Na+ excess: (1) hypertonic tissue Na+ accumulation, whereby Na+ would bind glycosaminoglycans (shaded) in the extracellular matrix in excess of water; (2) absolute expansion of the ECV, that is, edema; (3) accumulation of Na+ inside the cells, as for muscle; (4) relative but not absolute ECV predominance due to shrinking ICV (with or without additional edema). These patterns may coexist in different disease states. Bottom, Suggested mechanism described in long-term/experimental excess Na+ intake80,81 and other water-losing conditions,82–84 by which free water deficit or loss would induce a catabolic state and a loss of cellular mass and of K+, resulting in relative tissue Na+ excess, in the attempt to generate endogenous water moieties from the breakdown of proteins. Loss is depicted as a black X.

