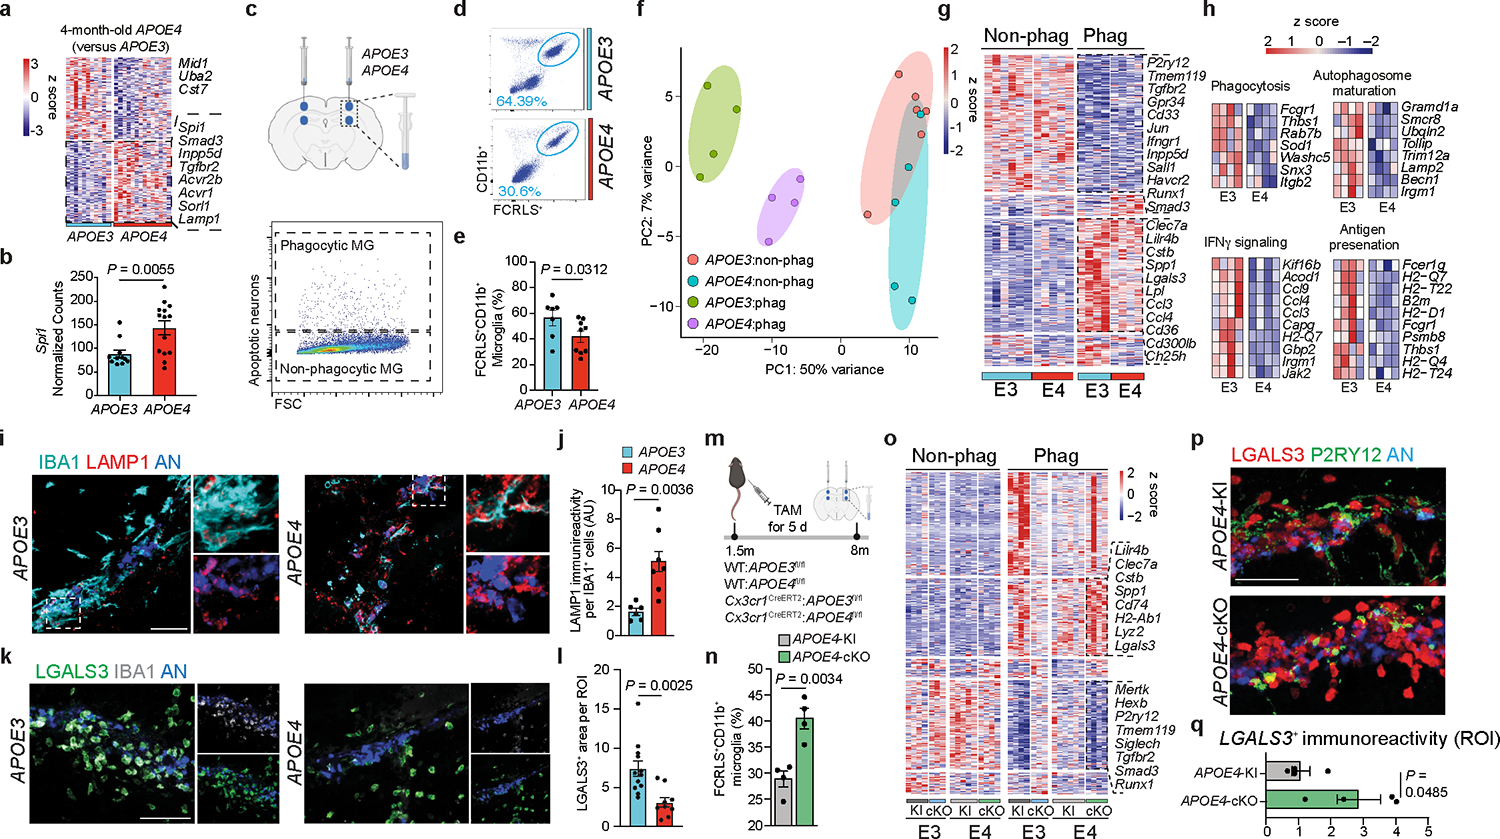
Fig. 1. APOE4 impairs the microglial response to acute neurodegeneration.

a, Heat map of differentially expressed genes from APOE4-KI vs. APOE3-KI microglia at 4 months of age (n = 11–14 mice per group, P < 0.05). b, Spi1 normalized counts (n = 11–14 mice per group). c, Top, schematics of apoptotic neurons injection to the cortex and hippocampus of 8-months-old APOE3-KI and APOE4-KI mice; Bottom, sorting strategy 16 h after injection of phagocytic and non-phagocytic microglia (MG) for labeled apoptotic neurons; Figure created with Biorender.com; FSC, forward scatter. d, Gating strategy for FCRLS+CD11b+ microglia from the apoptotic neuron injection site in APOE3-KI and APOE4-KI mice. e, Bar plot showing the percentage of FCRLS+CD11b+ cells (n = 7 APOE3-KI mice, n = 9 APOE4-KI mice). f, Principal component analysis (PCA) of each group; APOE3:non-phag, APOE4:non-phag; APOE3:phag, APOE4:phag. g, Heat map of phagocytic and non-phagocytic microglia from APOE3-KI (E3) and APOE4-KI (E4) mice. Differentially expressed genes were identified using DESeq2 analysis with a likelihood ratio test (LRT; n = 4–6 mice per group, P < 0.05). h, Gene ontology analysis of differentially expressed genes for phagocytosis, autophagosome maturation, IFNγ signaling and antigen presentation (P < 0.05). i, Confocal microscopy images of IBA1, LAMP1 and apoptotic neurons (AN) at the injection sites. j, Quantification of LAMP1 immunoreactivity per IBA1+ cell (n = 6 APOE3-KI mice, n = 7 APOE4-KI mice); AU, arbitrary units. k, Confocal microscopy images of IBA1, LGALS3 and apoptotic neurons at the injection sites. l, Quantification of LGALS3+ area per region of interest (ROI) at the injection site (n = 12 ROIs from the APOE3-KI group, n = 9 ROIs from the APOE4-KI group). m, Schematics of tamoxifen (TAM) administration at 1.5 months of age and the injection of apoptotic neuron to cortex and hippocampus of 8-months-old APOE3-KI, APOE4-KI, APOE3-cKO and APOE4-cKO mice. Figure created with Biorender.com. n, Percentage of FCRLS+CD11b+ microglia in the injection site in APOE4-KI and APOE4-cKO mice (n = 4 mice per group). o, Heat map of non-phagocytic and phagocytic microglia isolated from APOE3-KI, APOE3-cKO, APOE4-KI, and APOE4-cKO injected with apoptotic neurons. Differentially expressed genes were identified using DESeq2 analysis with an LRT (n = 3–6 mice per group, P < 0.05). p, Confocal images of P2RY12, LGALS3, and apoptotic neurons from APOE4-KI and APOE4-cKO mice. q, Quantification of LGALS3+ area per ROI at injection sites (n = 4 mice per group). Data were analyzed by two-tailed Student’s t-test. Scale bars, 50 μm. Data are presented as mean ± s.e.m.
