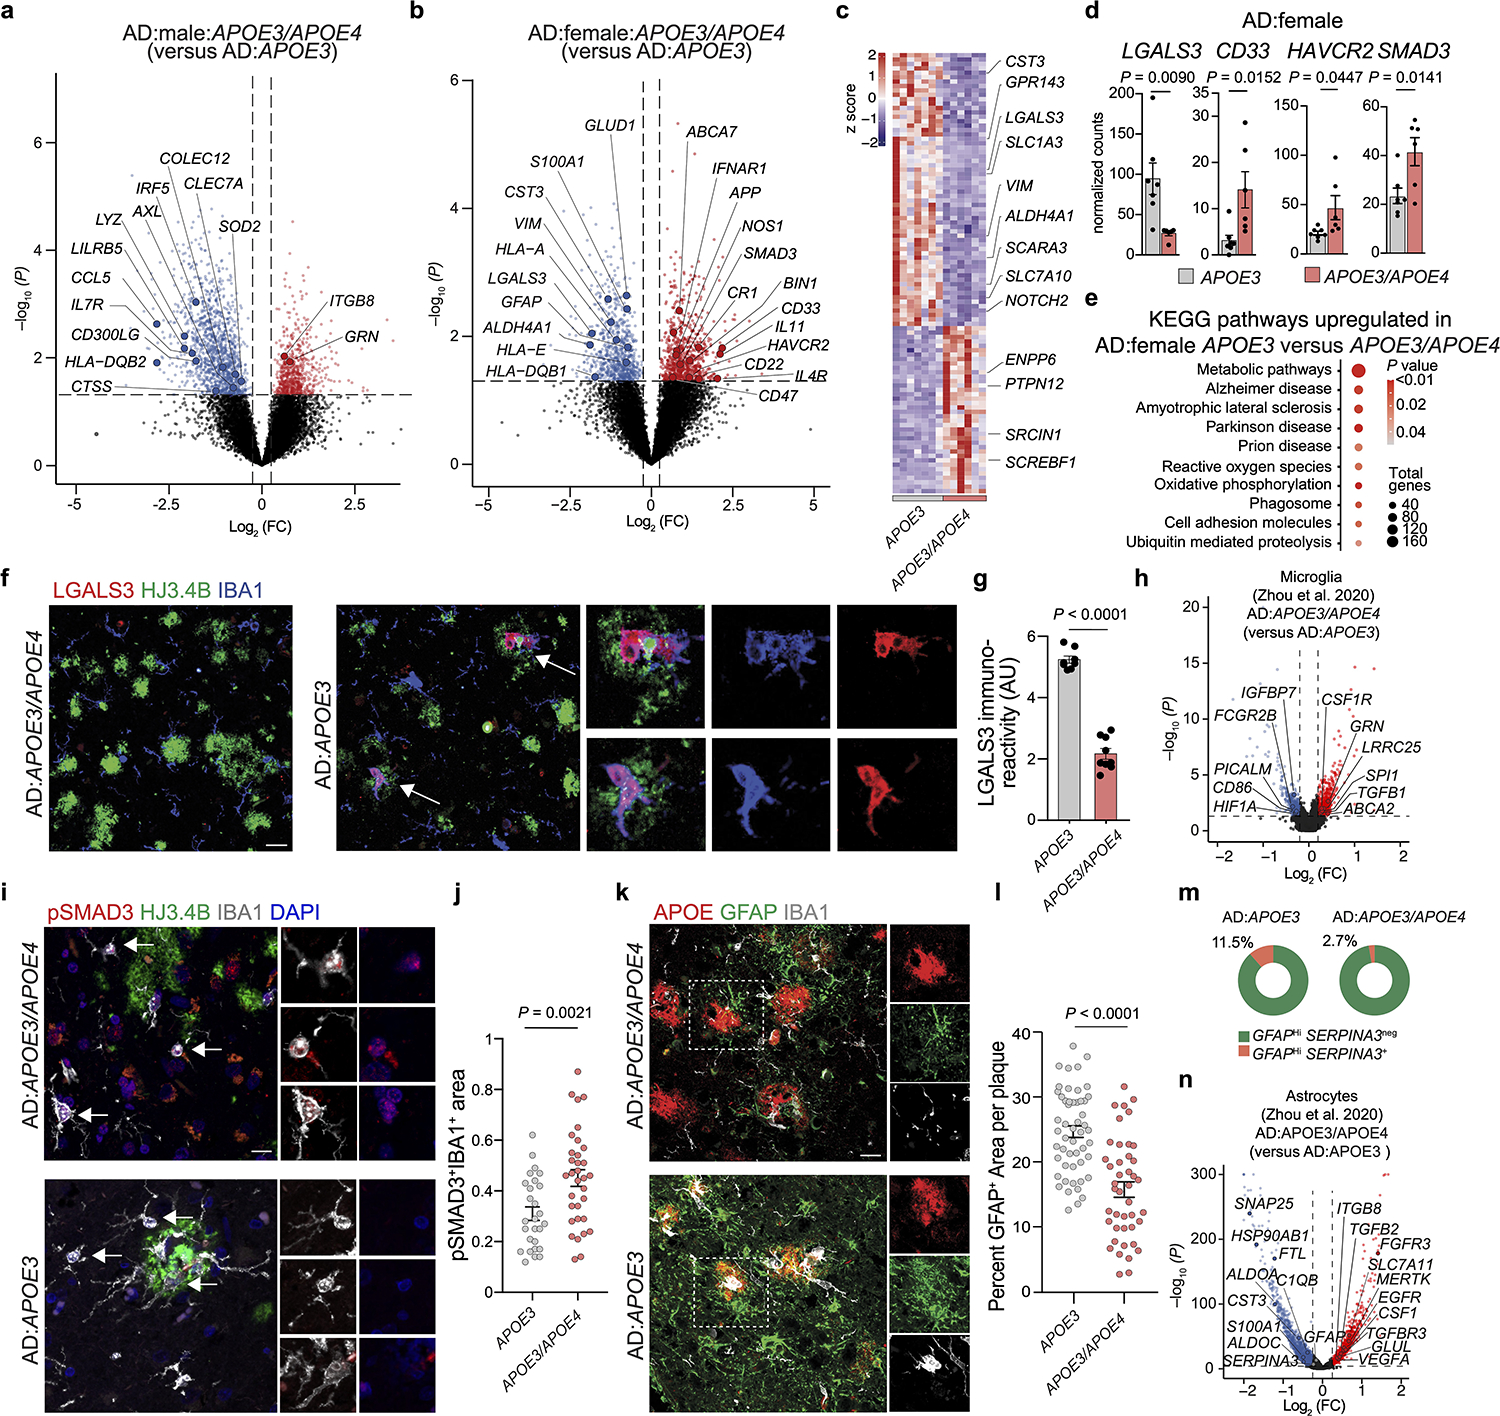
Fig. 7. Impaired induction of the MGnD signature and astrocytes activation in individuals with AD that carry the APOE4 allele.

a,b, Volcano plot of bulk RNA-seq analysis of total brain tissue isolated from males (a) and females (b) showing selected differentially expressed genes in individuals that are heterozygous for the APOE3 and APOE4 alleles compared to those that are homozygous for the APOE3 allele (male n = 5–7 donors, female n = 6–7 donors, P < 0.05). c, Top 100 differentially expressed genes from female AD:heterozygous APOE3/APOE4 carriers compared to AD:homozygous APOE3 carriers (P < 0.05, n = 6–7 donors per group). d, Normalized counts of key affected genes (n = 7 AD:homozygous APOE3 carriers, n = 6 AD:heterozygous APOE3/APOE4 carriers). e, Top-affected KEGG pathways in female AD:homozygous APOE3 carriers compared to AD:heterozygous APOE3/APOE4 carriers. f, Confocal microscopy images of brain sections from females with AD that are homozygous for the APOE3 allele or heterozygous for the APOE3 and APOE4 alleles stained for LGALS3, HJ3.4B-plaque and IBA1. g, Quantification of LGALS3+ immunoreactivity (n = 8 AD:homozygous APOE3 carriers, n = 9 AD:heterozygous APOE3/APOE4 carriers). h, Volcano plot of microglial differentially expressed genes in AD:heterozygous APOE3/APOE4 carriers compared to AD:homozygous APOE3 carriers analyzed from dataset by Zhou et al.35 (n = 6 AD:homozygous APOE3 carriers, n = 4 AD:heterozygous APOE3/APOE4 carriers, P < 0.05). i, Confocal images of brain sections from female individuals with AD homozygous for the APOE3 allele or heterozygous for the APOE3 and APOE4 alleles stained for pSMAD3, IBA1, and HJ3.4B. j, Quantification of pSMAD3 immunoreactivity in IBA1+ cells (n = 27 cells from AD:homozygous APOE3 carriers, n = 33 cells from AD:heterozygous APOE3/APOE4 carriers ). k, Confocal microscopy images of GFAP in the brains of individuals with AD that are homozygous for the APOE3 allele or heterozygous for the APOE3 and APOE4 alleles. l, Quantification of GFAP immunoreactivity per plaque (n = 52 plaques from AD:homozygous APOE3 carriers, n = 43 plaques from AD:heterozygous APOE3/APOE4 carrier). m, Donut plots representing analysis from dataset by Zhou et al.35, showing the percentage of GFAPhiSERPINA3+ and GFAPhiSERPINA3− astrocyte clusters in AD:heterozygous APOE3/APOE4 carriers and AD:homozygous APOE3 carriers. n, Volcano plot of astrocytic differentially expressed genes of AD:heterozygous APOE3/APOE4 carriers compared to AD:homozygous APOE3 carriers analyzed from the dataset by Zhou et al.35 (n = 6 AD:homozygous APOE3 carriers, n = 4 AD:heterozygous APOE3/APOE4 carriers, P < 0.05). Arrows indicate ROIs for f and i. Data were analyzed by two-tailed Student’s t-test and are presented as mean ± s.e.m.; scale bars, 50 μm.
