
Extended Data Fig. 1 |. APOE4 impairs microglial response to acute neurodegeneration.
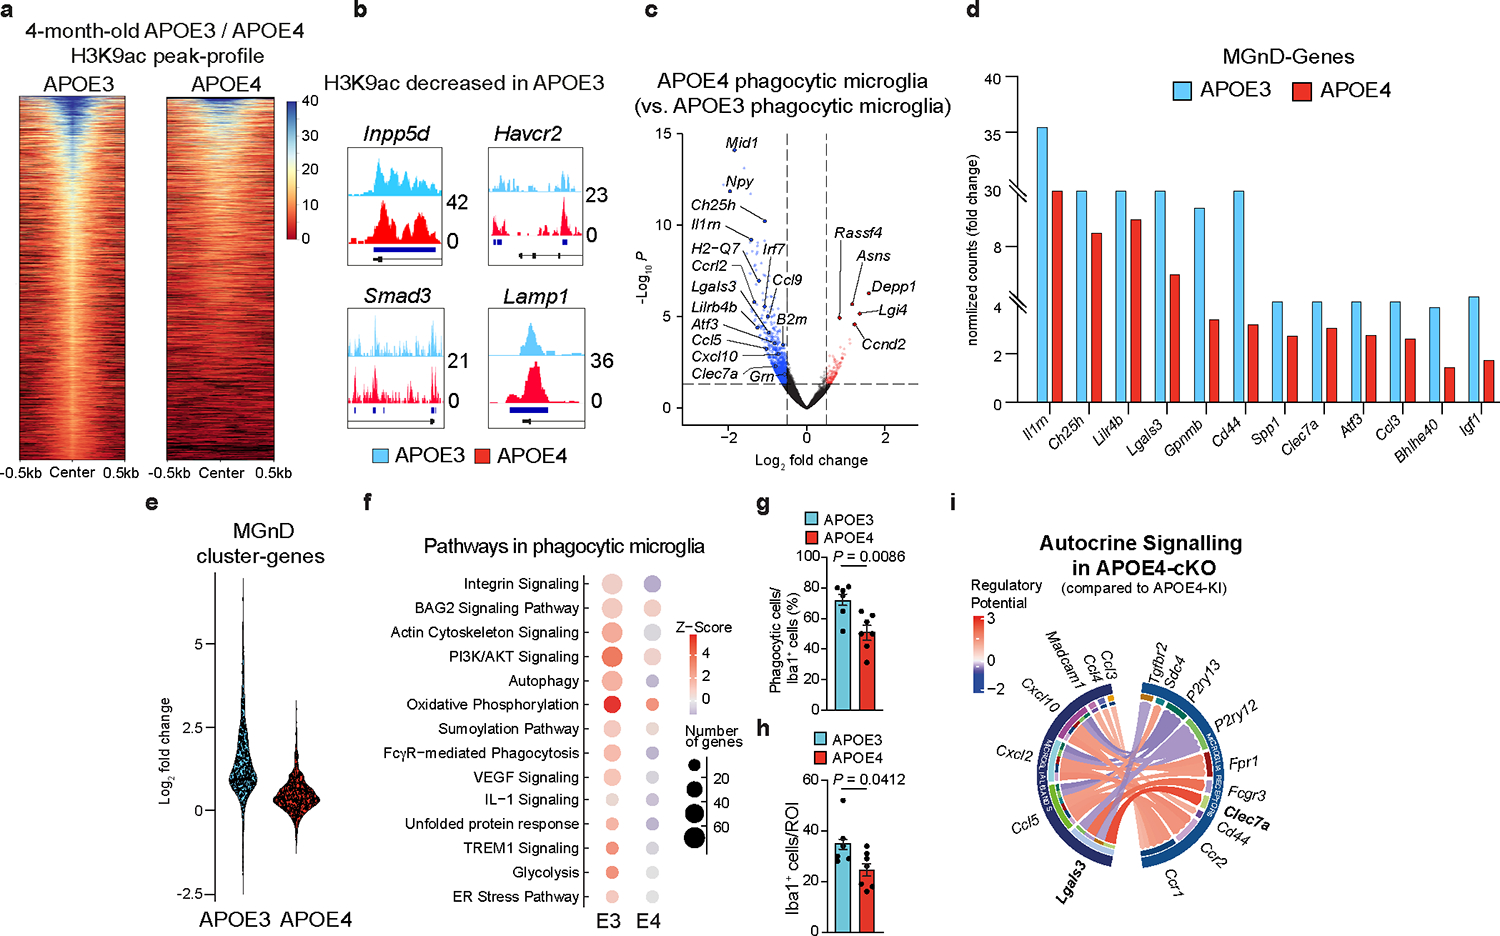
a, H3K9ac peak-plot heat map of microglia from 4-month-old APOE3-KI or APOE4-KI mice (n = 3 mice/group). b, H3K9ac peaks of key genes. c, Volcano plot of DEGs of phagocytic microglia isolated from APOE4-KI vs. APOE3-KI mice. DEGs were identified using DESeq2 analysis with an LRT (n = 4–6 mice/group, P < 0.05). d, Fold change induction of key MGnD genes expressed in phagocytic microglia relative to non-phagocytic microglia, isolated from APOE3-KI and APOE4-KI mice. DEGs were identified using DESeq2 analysis with an LRT and key MGnD genes were selected from Krasemann et al.4. e, Violin plot of top-300 induced MGnD genes in phagocytic microglia isolated from APOE3-KI and APOE4-KI mice (Fig. 1g). f, Top-affected canonical pathways in phagocytic microglia compared to non-phagocytic microglia from APOE3-KI and APOE4-KI mice (P < 0.05). g, Quantification of phagocytic Iba1+ cell numbers from AN-injected APOE3-KI and APOE4-KI mice (n = 6 APOE3-KI mice, n = 7 APOE4-KI mice). h, Quantification of Iba1+ cells from AN-injected APOE3-KI and APOE4-KI mice (n = 6 APOE3-KI mice, n = 7 APOE4-KI mice). i, Circos plot illustrating ligand- receptor interactions in APOE4-cKO microglia compared to APOE4-KI microglia. Two-tailed Student’s t-test. Data were presented as mean ± s.e.m.