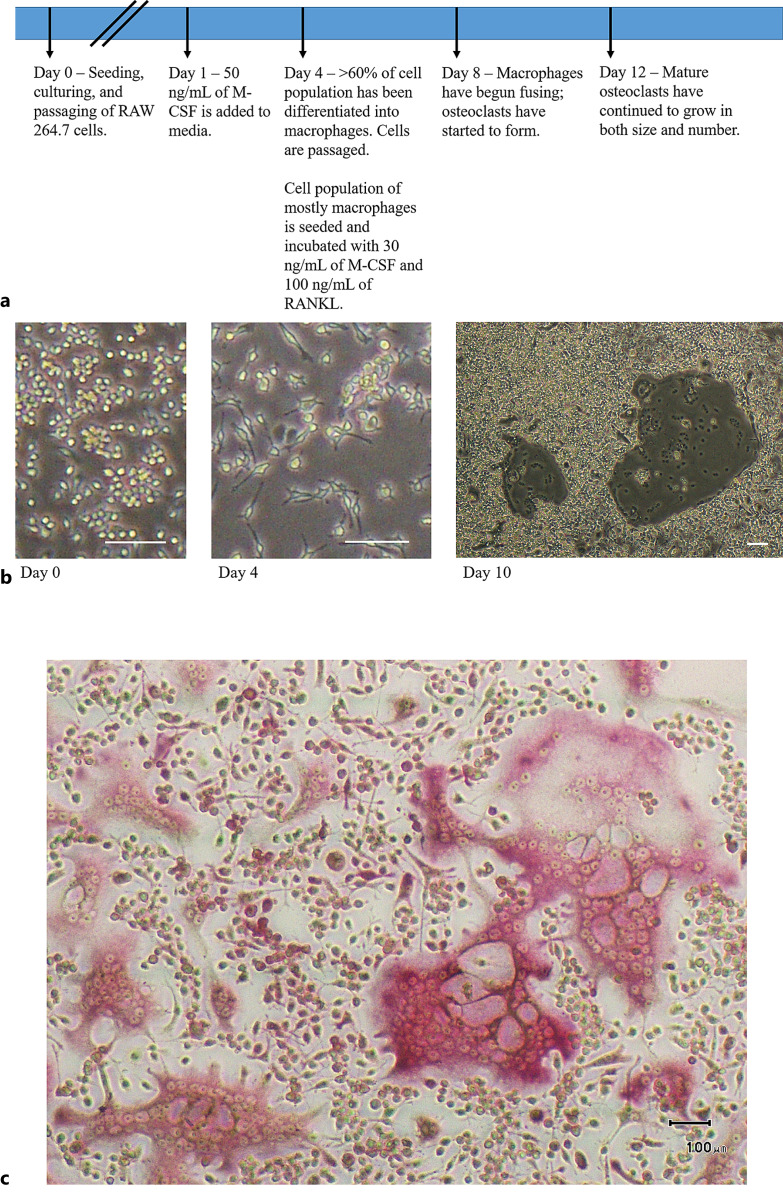
Fig. 1.
Differentiation of RAW 264.7 cells into osteoclasts. a Timeline of cell passaging and differentiation process. b Representative phase-contrast micrographs demonstrating the distinct phases of osteoclast differentiation. The first image of panel b shows RAW 264.7 cells on day 0; the second image is captured on day 4, after RAW 264.7 cells have been incubated with M-CSF to differentiate into macrophages; the third image is captured from day 10, with two mature osteoclasts visible. c Positive TRAP staining demonstrating successful differentiation. Scale bar, 100 μm. TRAP, tartrate-resistant acid phosphatase.

