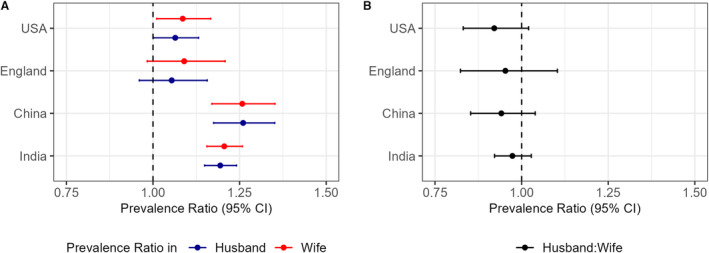
Figure 2. Associations of hypertension status between couples and sex differences within each country.

A, Association of hypertension status between couples (Table S4, Equation 1a and 1b). B, Sex difference in associations comparing husbands and wives (Table S4; Equation 2). All values are survey‐weighted prevalence ratios with 95% robust CIs, after adjusting for individual characteristics and household characteristics.
