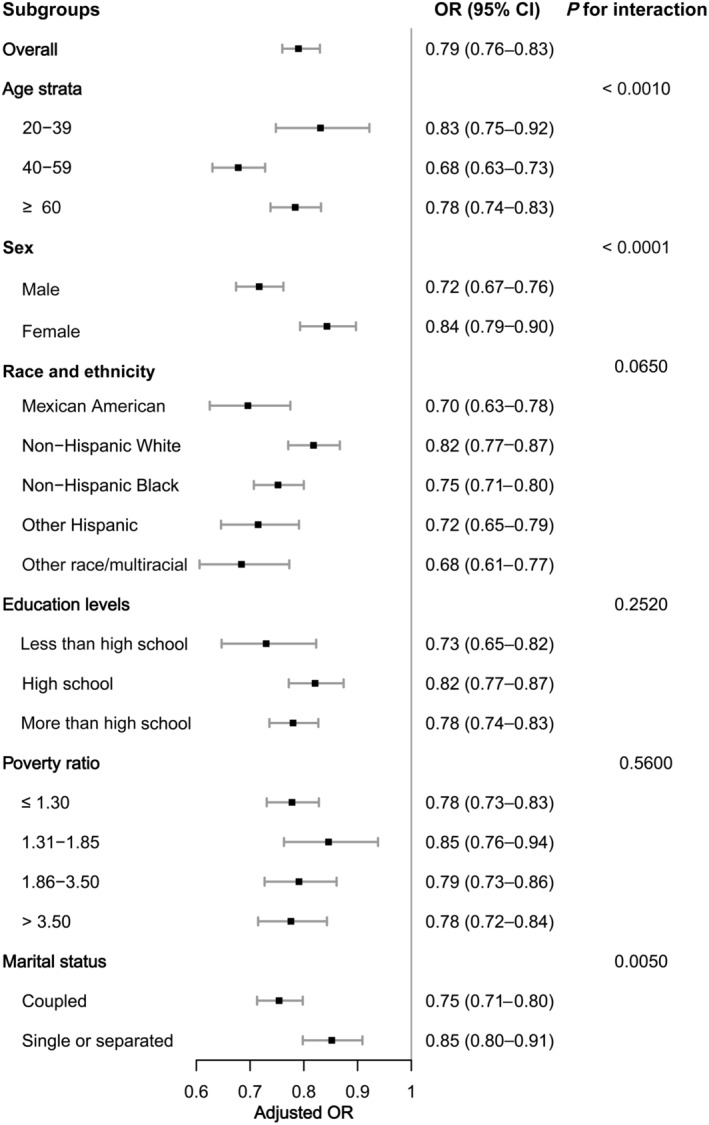
Figure 3. Subgroup analysis of the association of LE8 scores and the presence of CKD.

OR was calculated as per 10‐point increase in LE8 score. Each stratification was adjusted for age (as a continuous variable), sex, race and ethnicity, poverty ratio (as a continuous variable), education levels, and marital status. CKD indicates chronic kidney disease; LE8, Life's Essential 8; and OR, odds ratio.
