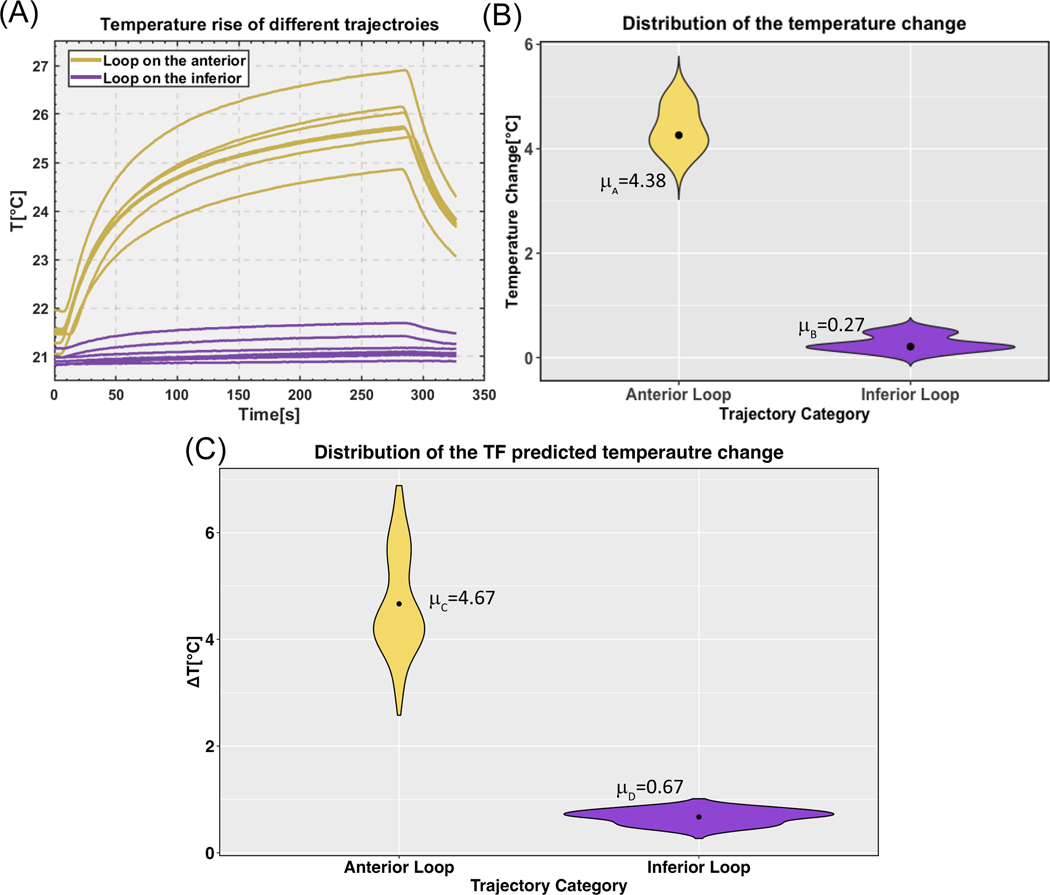
Figure 10:
(A) Temperature rise at the tip of a 35-cm epicardial lead with fourteen different trajectories (all illustrated in Figure 7). (B) Violin plots of the temperature rise distributions with the mean value plotted for each trajectory category. (C) Violin plots of the transfer function predicted temperature rise distributions with the mean value for each trajectory category (data pooled over both head-first and feet-first orientations).

