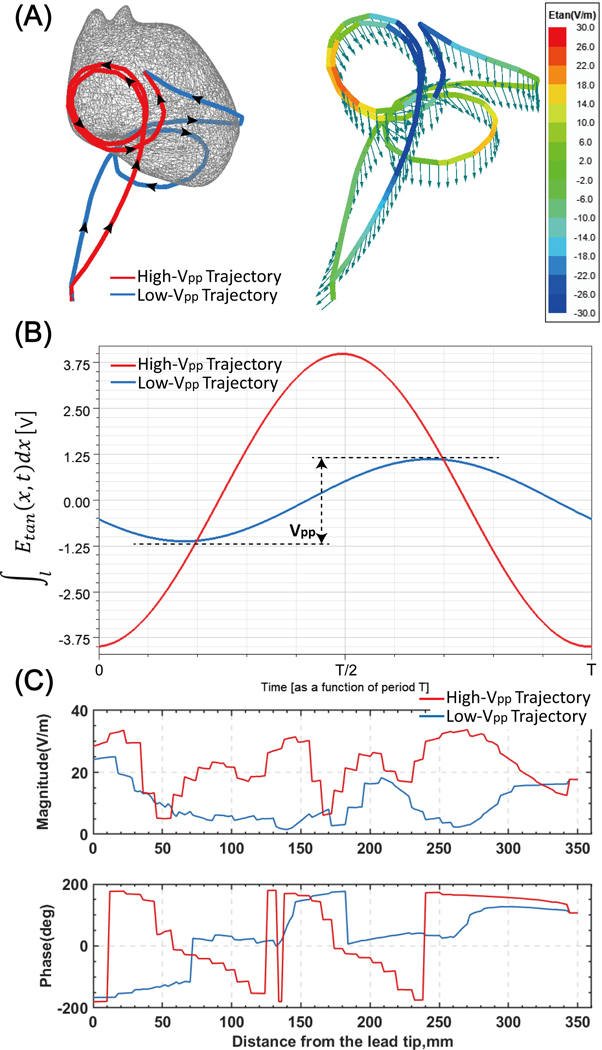
Figure 4:
(A) Left: Two representative epicardial lead trajectories with loops on the anterior surface (high-Vpp trajectory) and inferior surface of the heart (low-Vpp trajectory) superimposed on one heart model. Right: Green arrows show the incident electric field along the trajectory of each lead. Etan is also overlaid on each lead trajectory as a color field. (B) The time evolution of induced voltage for each trajectory. Plots correspond to simulations performed with the body positioned head-first and at the chest imaging landmark. (C) Magnitude and phase of Etan along each lead trajectory.

