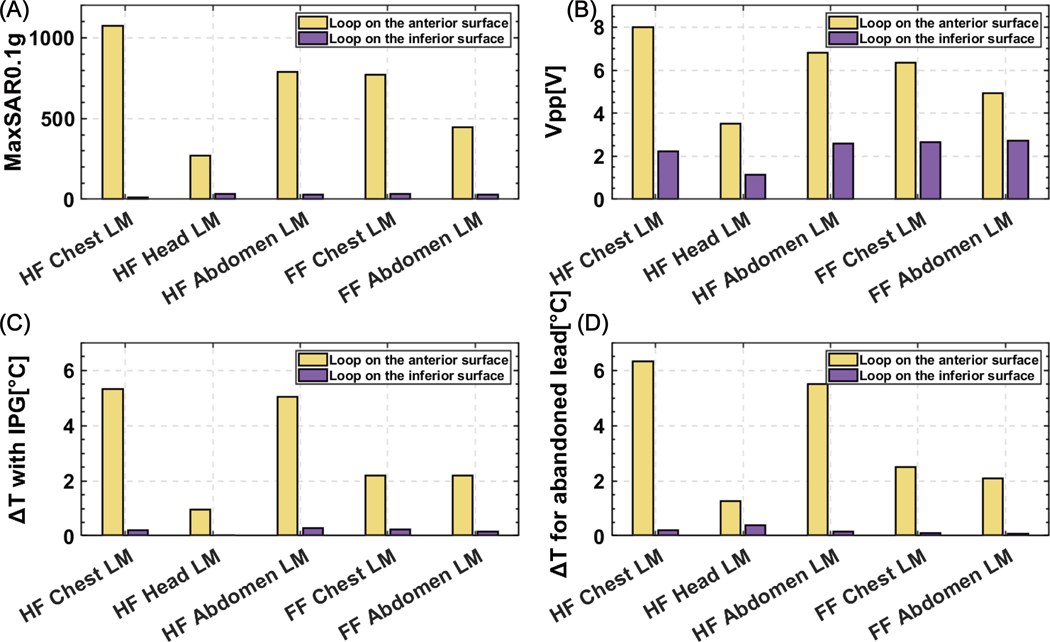
Figure 9:
(A) Maximum of 0.1g-averaged SAR (MaxSAR0.1g) and (B) Vpp were calculated around the tip of the lead for an anterior and inferior loop trajectory for five different scanning positions; (C) Temperature rise at the tip of the lead connected to the IPG and (D) Temperature rise at the tip of the abandoned lead was recorded during the RF exposure.

