
Figure 2.
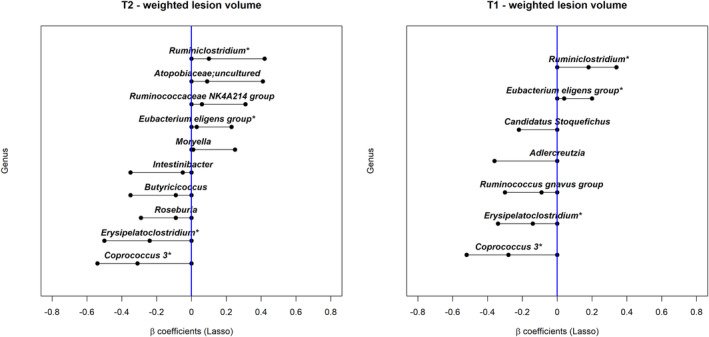
The association between the gut microbiota (genus level) and brain MRI lesion volumes (cube root transformed) in the pediatric‐onset MS cohort. “*” indicates that the taxon was identified for both T1 and T2 lesion volumes. Interpretation: The β values and their 95% confidence intervals were assessed using Lasso regression. The β value represents the mean difference in lesion volume (cube root transformed) between the participants with normalized gut microbiota relative abundance above the median vs those below or equal to the median after adjusting for the other ASVs in the model; a positive β value indicates that a high relative abundance was associated with a higher lesion volume. A difference of 0.33 and 0.18 corresponds to 20% above or below the overall sample mean for the (cube root transformed) T2 and T1 lesion volumes (mean = 1.6 and 0.9, respectively).