Figure 2.

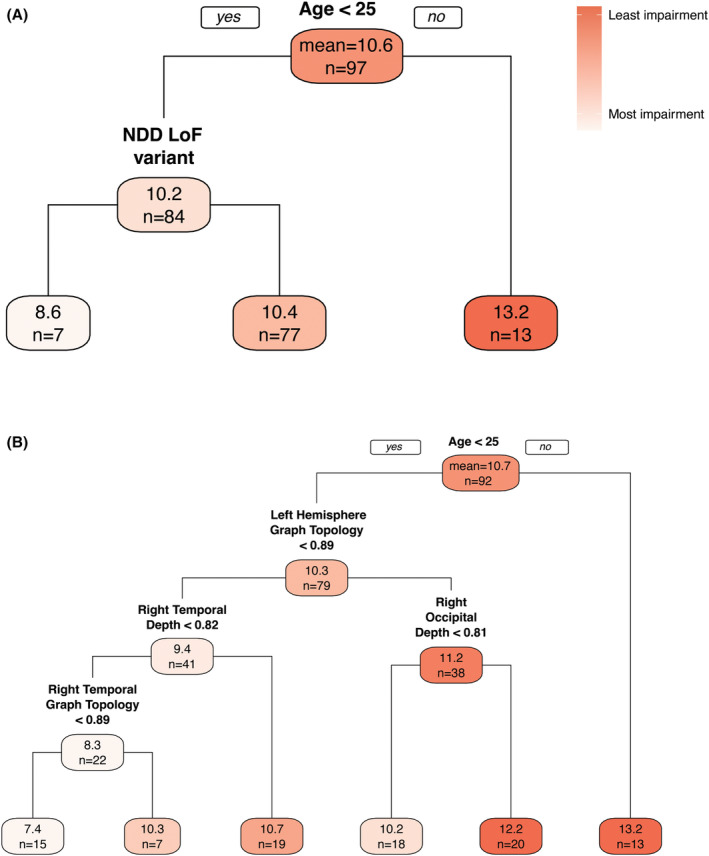
Regression trees predicting category switching accuracy with various candidate predictors. Tree (A) (n = 97, R 2 = 0.12, RMSE = 3.08, cross‐validation RMSE = 3.12) considers only patient demographic characteristics and genetic variants while Tree (B) (n = 92, R 2 = 0.30, RMSE = 2.76, cross‐validation RMSE = 3.12) additionally considers all sulcal measures. Each node indicates the mean category switching accuracy (top number) and sample size (bottom number) for participants with the characteristics along the paths above the node. For example, in tree A, 7 individuals aged <25 with an NDD LoF variant had the lowest mean score of 8.6 and 13 individuals aged >25 had the highest mean score of 13.2. LoF, loss‐of‐function; NDD, neurodevelopmental disability; RMSE, root mean squared error.
