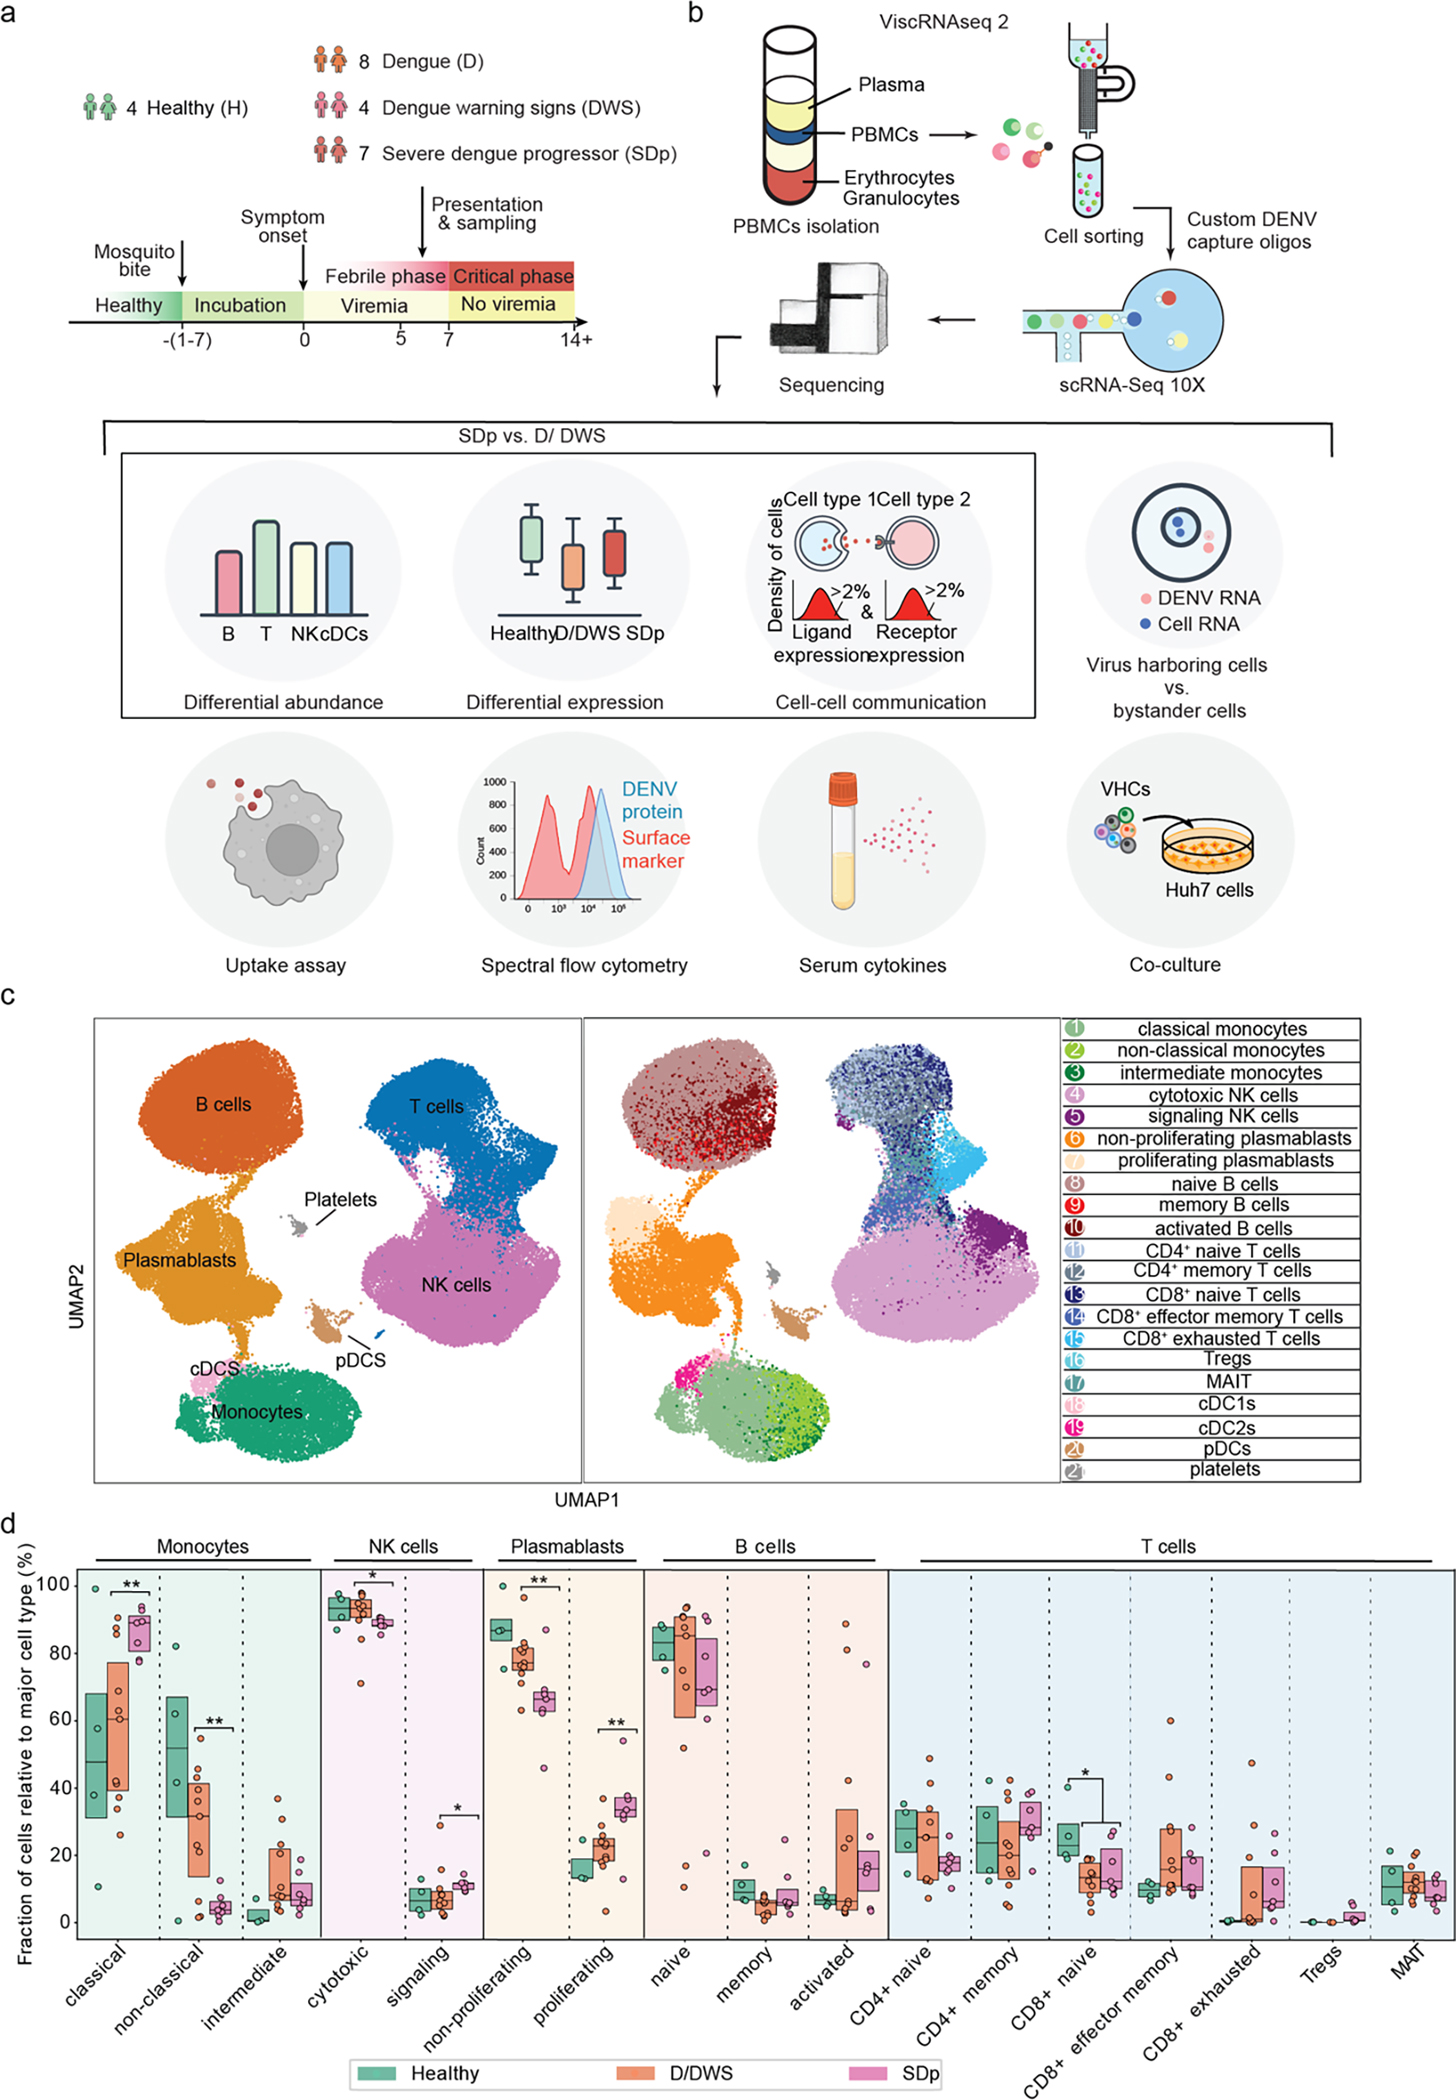
Fig.1: viscRNA-Seq 2 analysis of human-derived PBMCs defines 21 immune cell subtypes and alterations in their abundance accompanying SD progression.

a-b, Schematic of the study design. a, PBMC and serum samples were collected from children enrolled in the Colombia dengue cohort upon presentation to the clinic (D, DWS, SD) and from healthy children (H). b, Schematic of the experimental and computational components of viscRNA-Seq 2 and outline of the performed functional and validation assays on patient-derived PBMCs. c, UMAP embedding of the viscRNA-Seq 2 dataset indicating broad cell types (left) and subtypes (right). d, Box plots showing the fractions (%) of cell subtypes within each major immune cell type. The Box horizontal lines indicate the first, second (median) and third quartiles. Each dot represents a participant, color-coded by disease severity: H (green, n = 4); D/DWS (orange, n = 8/3); SDp (pink, n = 7). p values by two-tailed KS test are shown.
