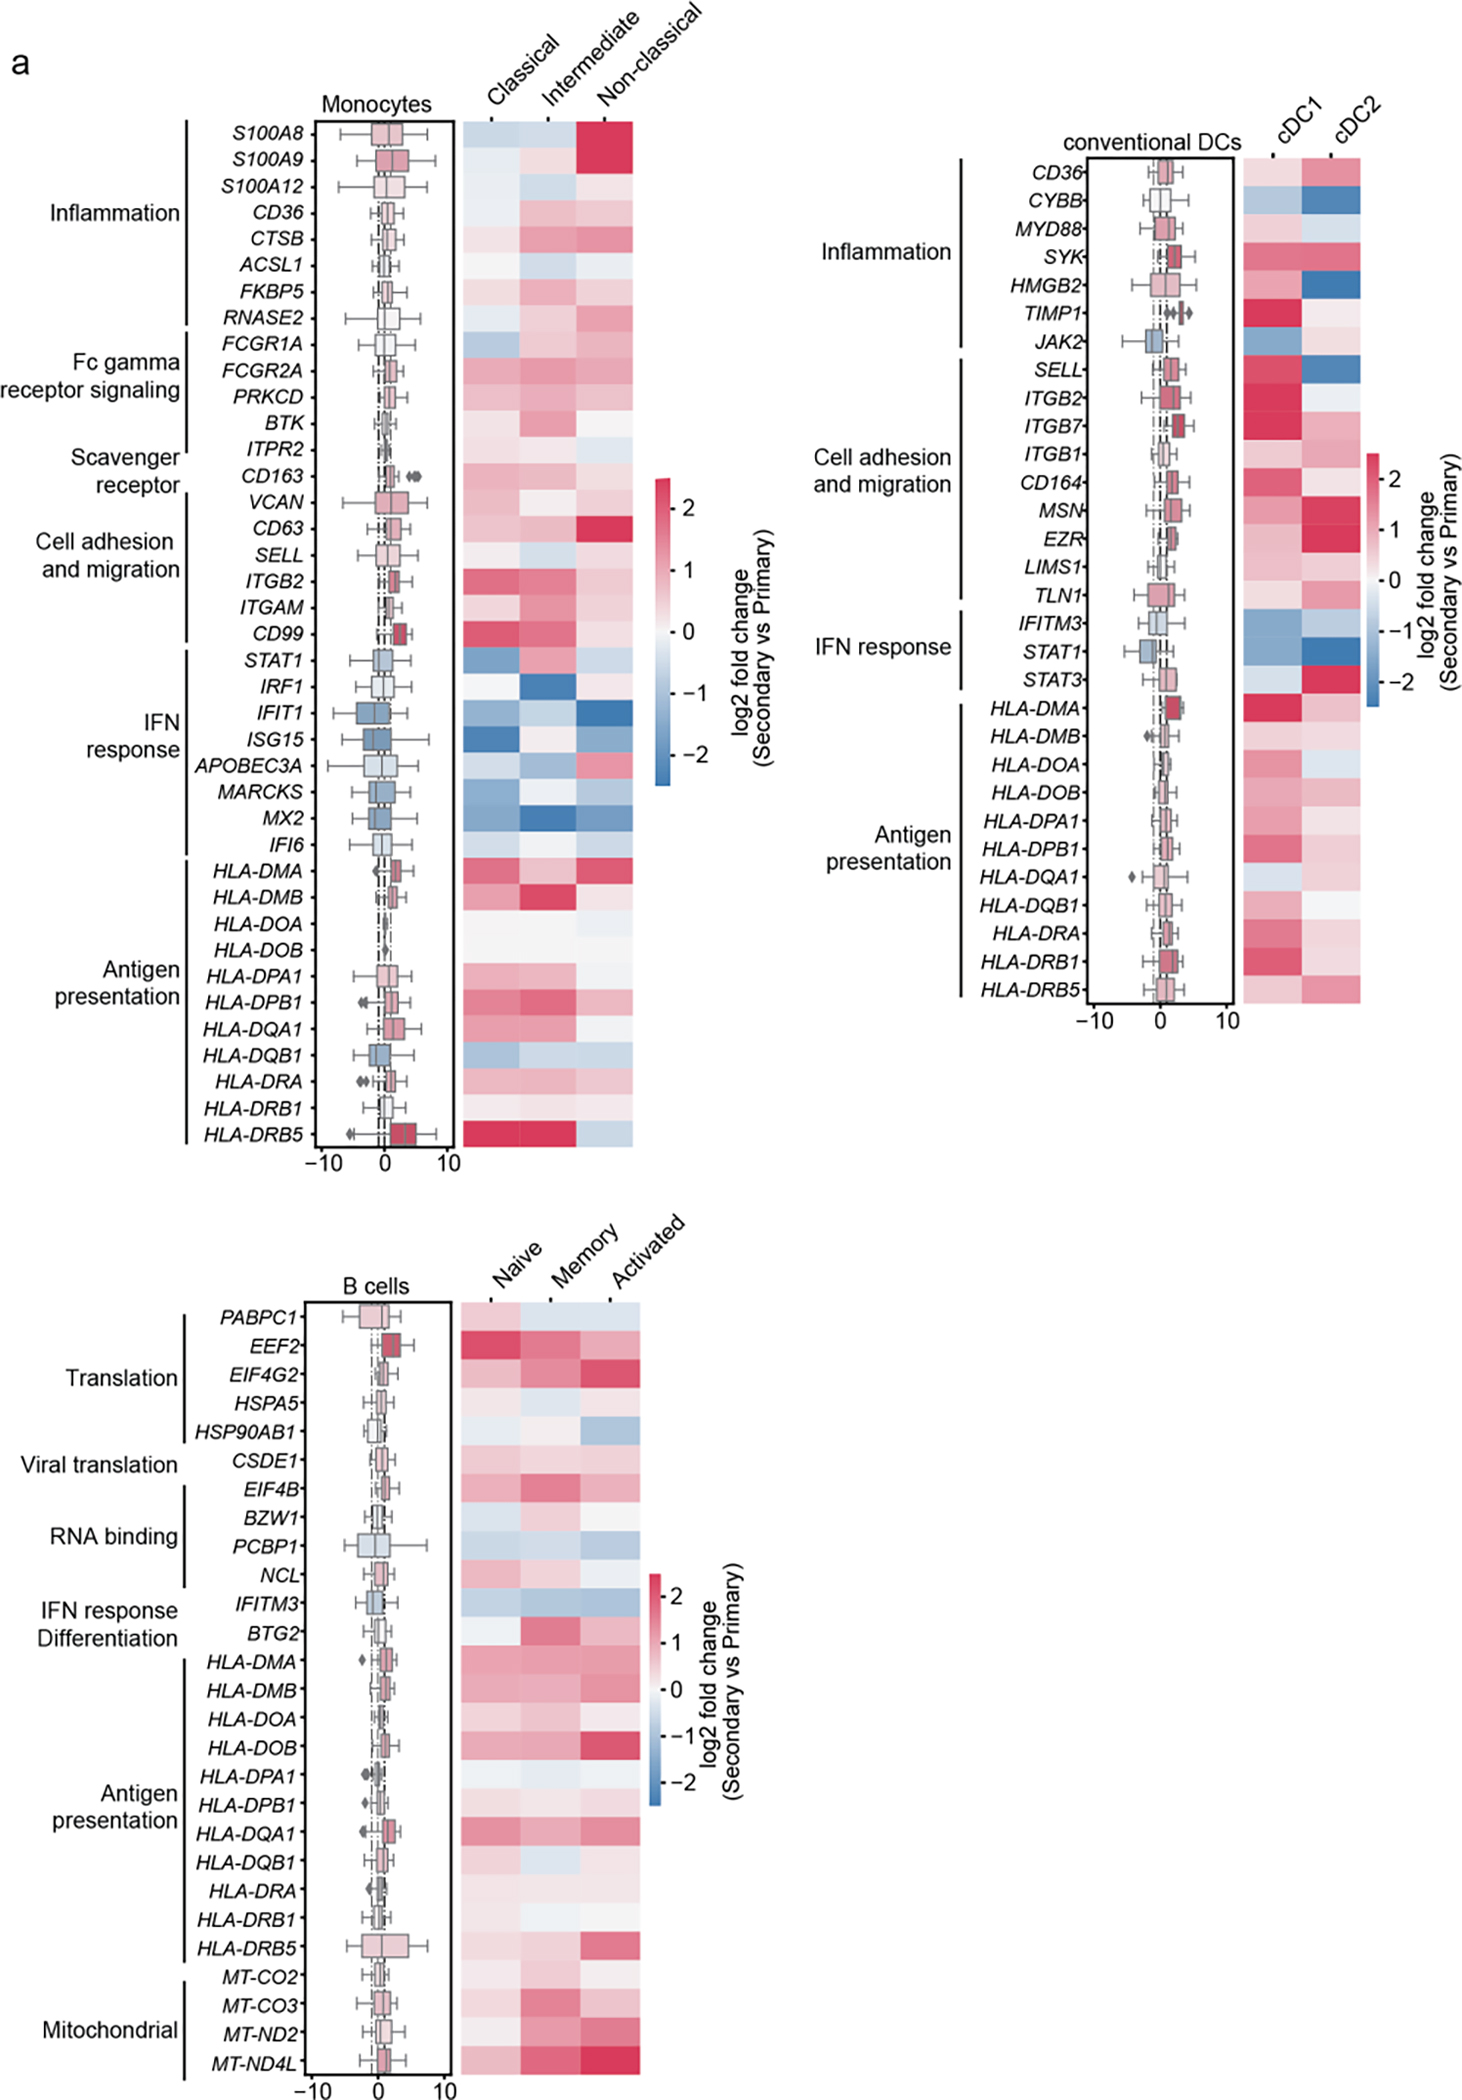
Fig.4. DEGS between SDp and D in APCs are only partially associated with prior DENV exposure.

a, Differentially expressed genes (DEGs) between D and SDp (Fig. 2a-c) were analyzed based on DENV exposure (Secondary vs. Primary) in monocyte, cDC, and B cell populations (Box plots, left) and the corresponding distinct cell subtypes (heatmaps, right). Data are color-coded based on the median log2 fold change of pairwise comparisons. Box plots’ horizontal lines indicate the first, second (median) and third quartiles
