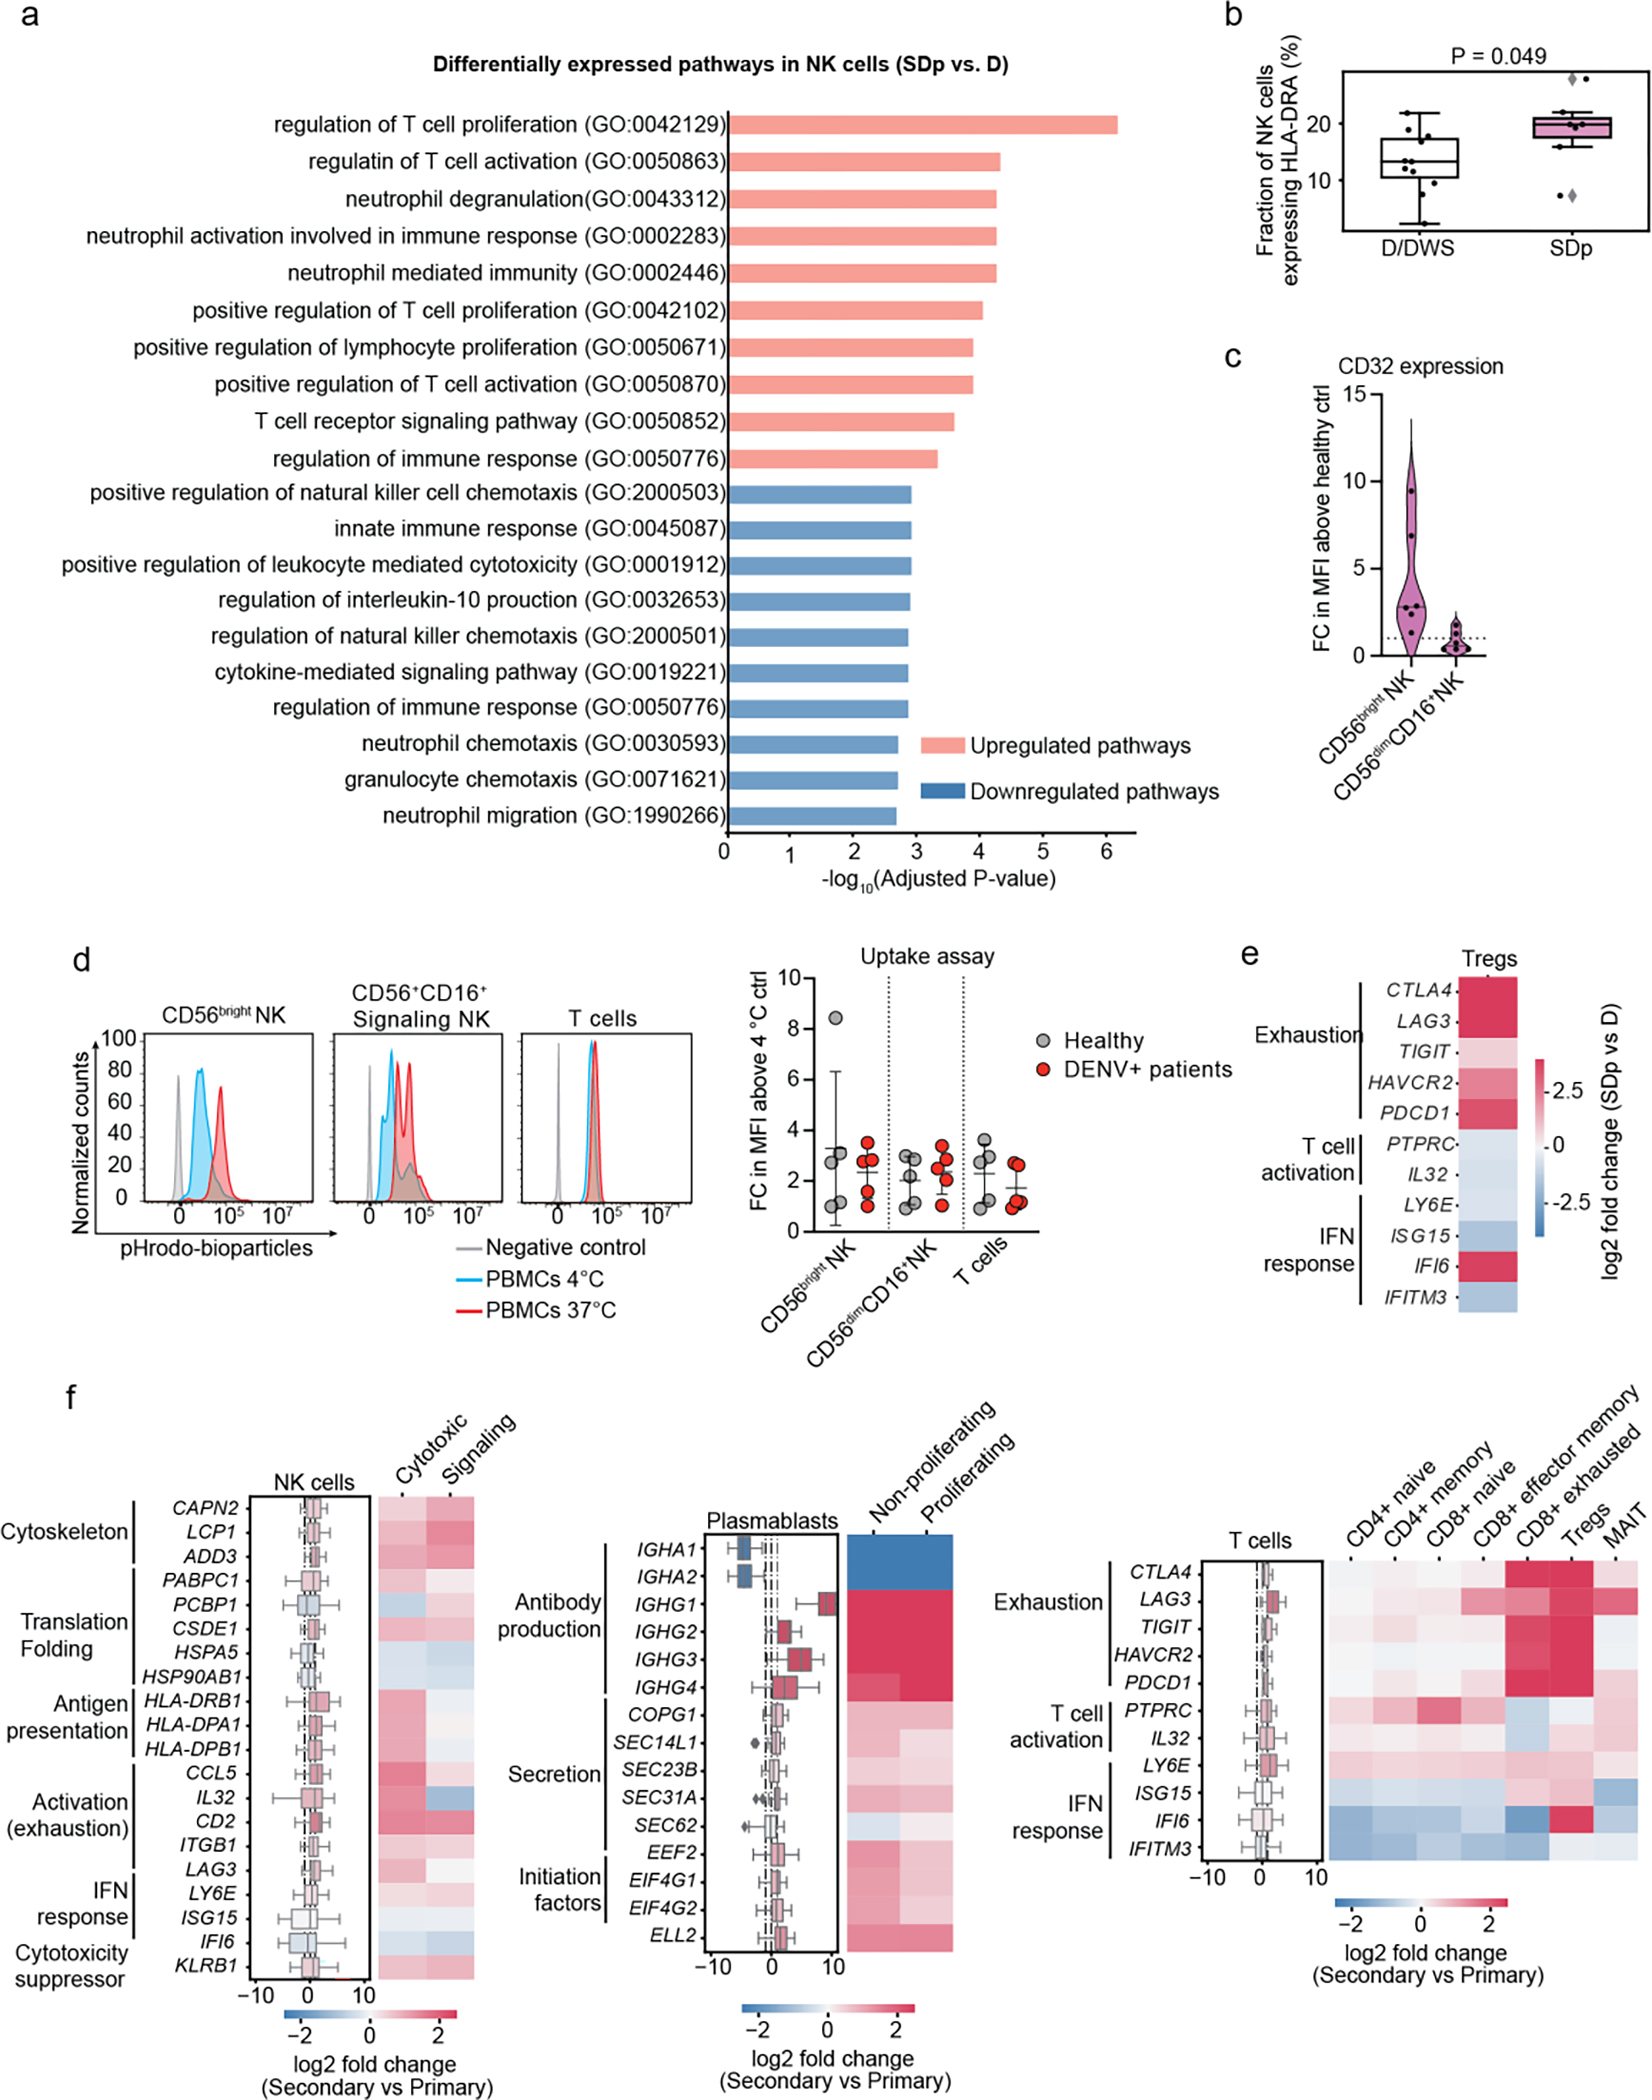
Fig.5: NK cells in SDp show activation and adaptive-like signatures that may be linked to a prior DENV exposure.

a, Pathway analysis showing top 10 upregulated and downregulated gene ontology (GO) terms between SDp and D in NK cells (see supplementary figure 3b for technical details). b, Fraction of NK cells expressing HLA-DRA gene out of the total NK cell population in D/DWS and SDp. c, Violin plots showing CD32 protein expression in CD56bright NK cells and CD56dimCD16+ NK cells measured via spectral flow cytometry in patient-derived PBMCs. Data are shown as fold change (FC) of mean fluorescence intensity (MFI) above healthy control (n=6, N=2). Dotted line represents mean value of healthy controls normalized to 1; horizontal line in each violin plot represents median value. d, Histograms showing the percentage of pHrodo Bioparticles positive cells in distinct cell subtypes derived from healthy (gray) and DENV-infected patients measured at 4 °C (cyan) or 37 °C (red). Dot plot showing bioparticle uptake quantification as FC of mean MFI above 4 °C control. Each dot represents an individual color-coded by disease status: healthy (gray) and DENV-infected (red) (n=5, N>2). e, DEGs between D and SDp detected in regulatory T cells (Tregs). Data are aggregated from all patients and color-coded based on log2 fold change. f, Differentially expressed genes (DEGs) between D and SDp (Fig. 3a–c) were analyzed based on DENV exposure (Secondary vs. Primary) for NK cell, plasmablast and T cell populations (Box plots, left) and the corresponding distinct cell subtypes (heatmaps, right). Data are color-coded based on median log2 fold change of pairwise comparisons. Box plots’ horizontal lines indicate the first, second (median) and third quartiles.
