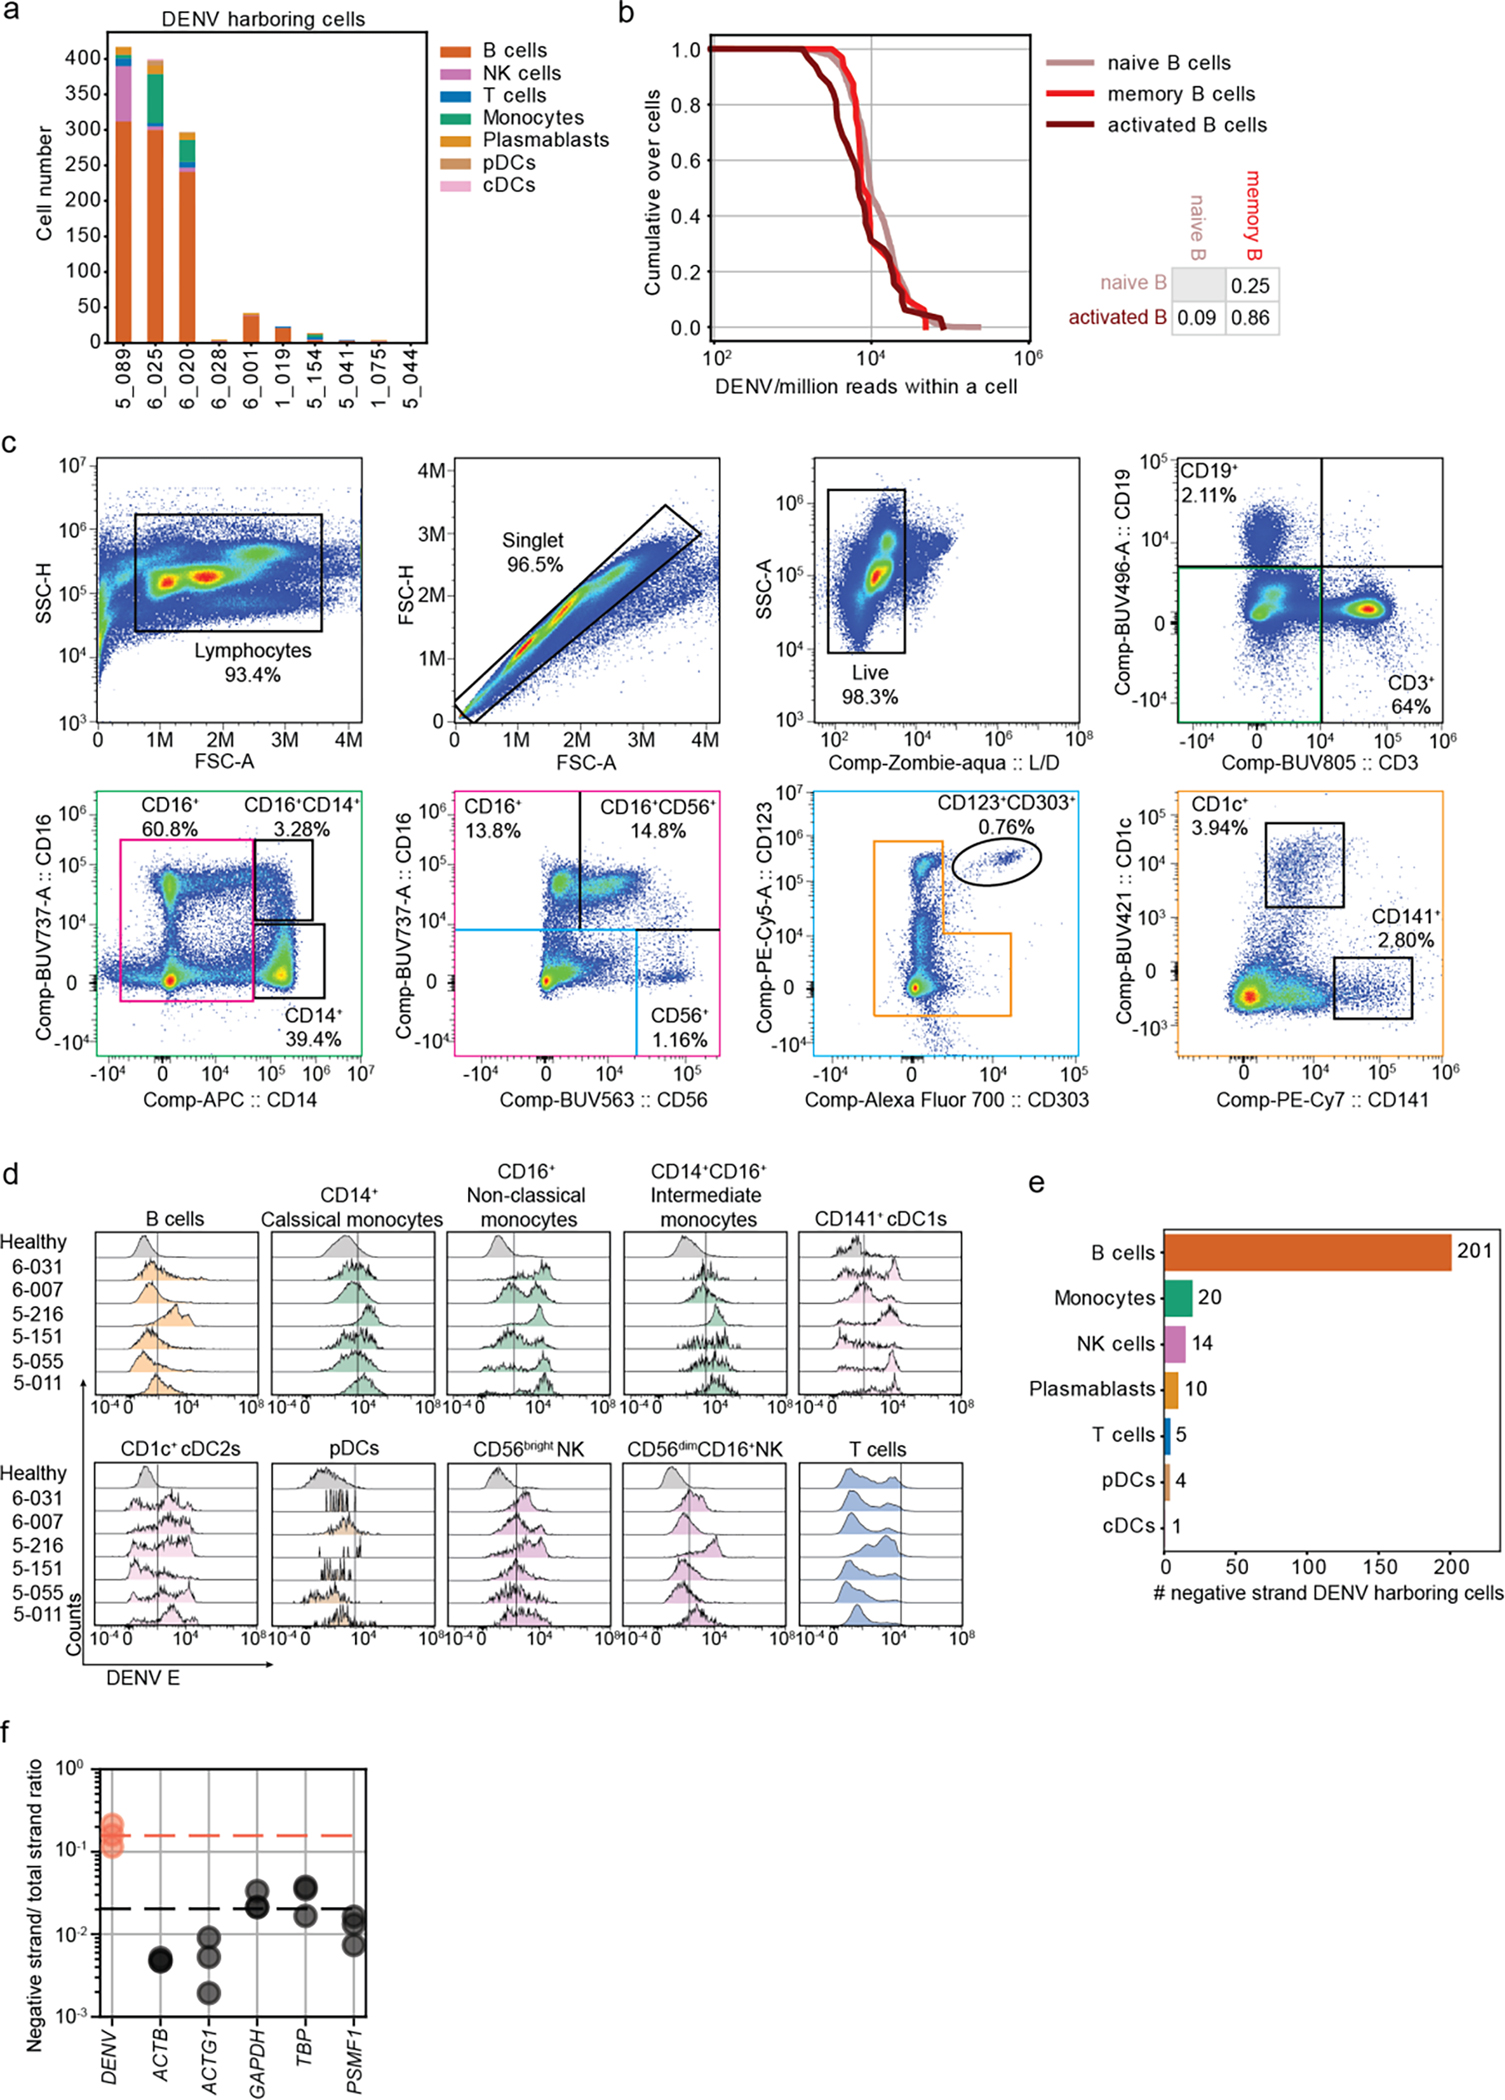
Fig.6: B cells from DENV-infected patients harbor replicating virus.

a, Stack bar plots showing the absolute numbers and distribution of VHCs across cell types in each of the 10 patients with detectable vRNA. b, Cumulative distributions of DENV reads/million reads per cell in B cell subtypes. p-values from KS test after Bonferroni correction between distinct B cell subtypes are indicated. c, Flow cytometry gating strategy used to define B cells (CD19+), T cells (CD3+), classical monocytes (CD14+CD16−), non-classical monocytes (CD14−CD16+), intermediate monocytes (CD14+CD16+), CD56bright NK cells, CD56dimCD16+ NK cells, pDCs (CD123+CD303+), cDC1s (CD141+) and cDC2s (CD1c+). d, Distributions of intracellular expression of DENV envelope (E) protein in B cells (CD19+), classical monocytes (CD14+CD16−), non-classical monocytes (CD14−CD16+), intermediate monocytes (CD14+CD16+), cDC1s (CD141+), cDC2s (CD1c+), pDCs (CD123+CD303+), CD56bright NK cells, CD56dimCD16+ NK cells, and T cells from the indicated DENV-infected patients with viremia ranging from 105 to 109 viral copies/mL (N=2,n=6 combined data) and healthy controls (N=2, n=6 combined data) measured via spectral flow cytometry. e, Number of negative strand RNA-harboring cells (VHCs) over total number of VHCs across immune cell types in three DWS patients with highest vRNA reads shown in Fig.4a. f, Dot plot showing the average ratio of negative strand over total strand of housekeeping genes (gray) and DENV RNA (orange) reads within the 20 single cells with the largest DENV read counts in 3 DWS patients with highest vRNA reads shown in Fig.4a.
