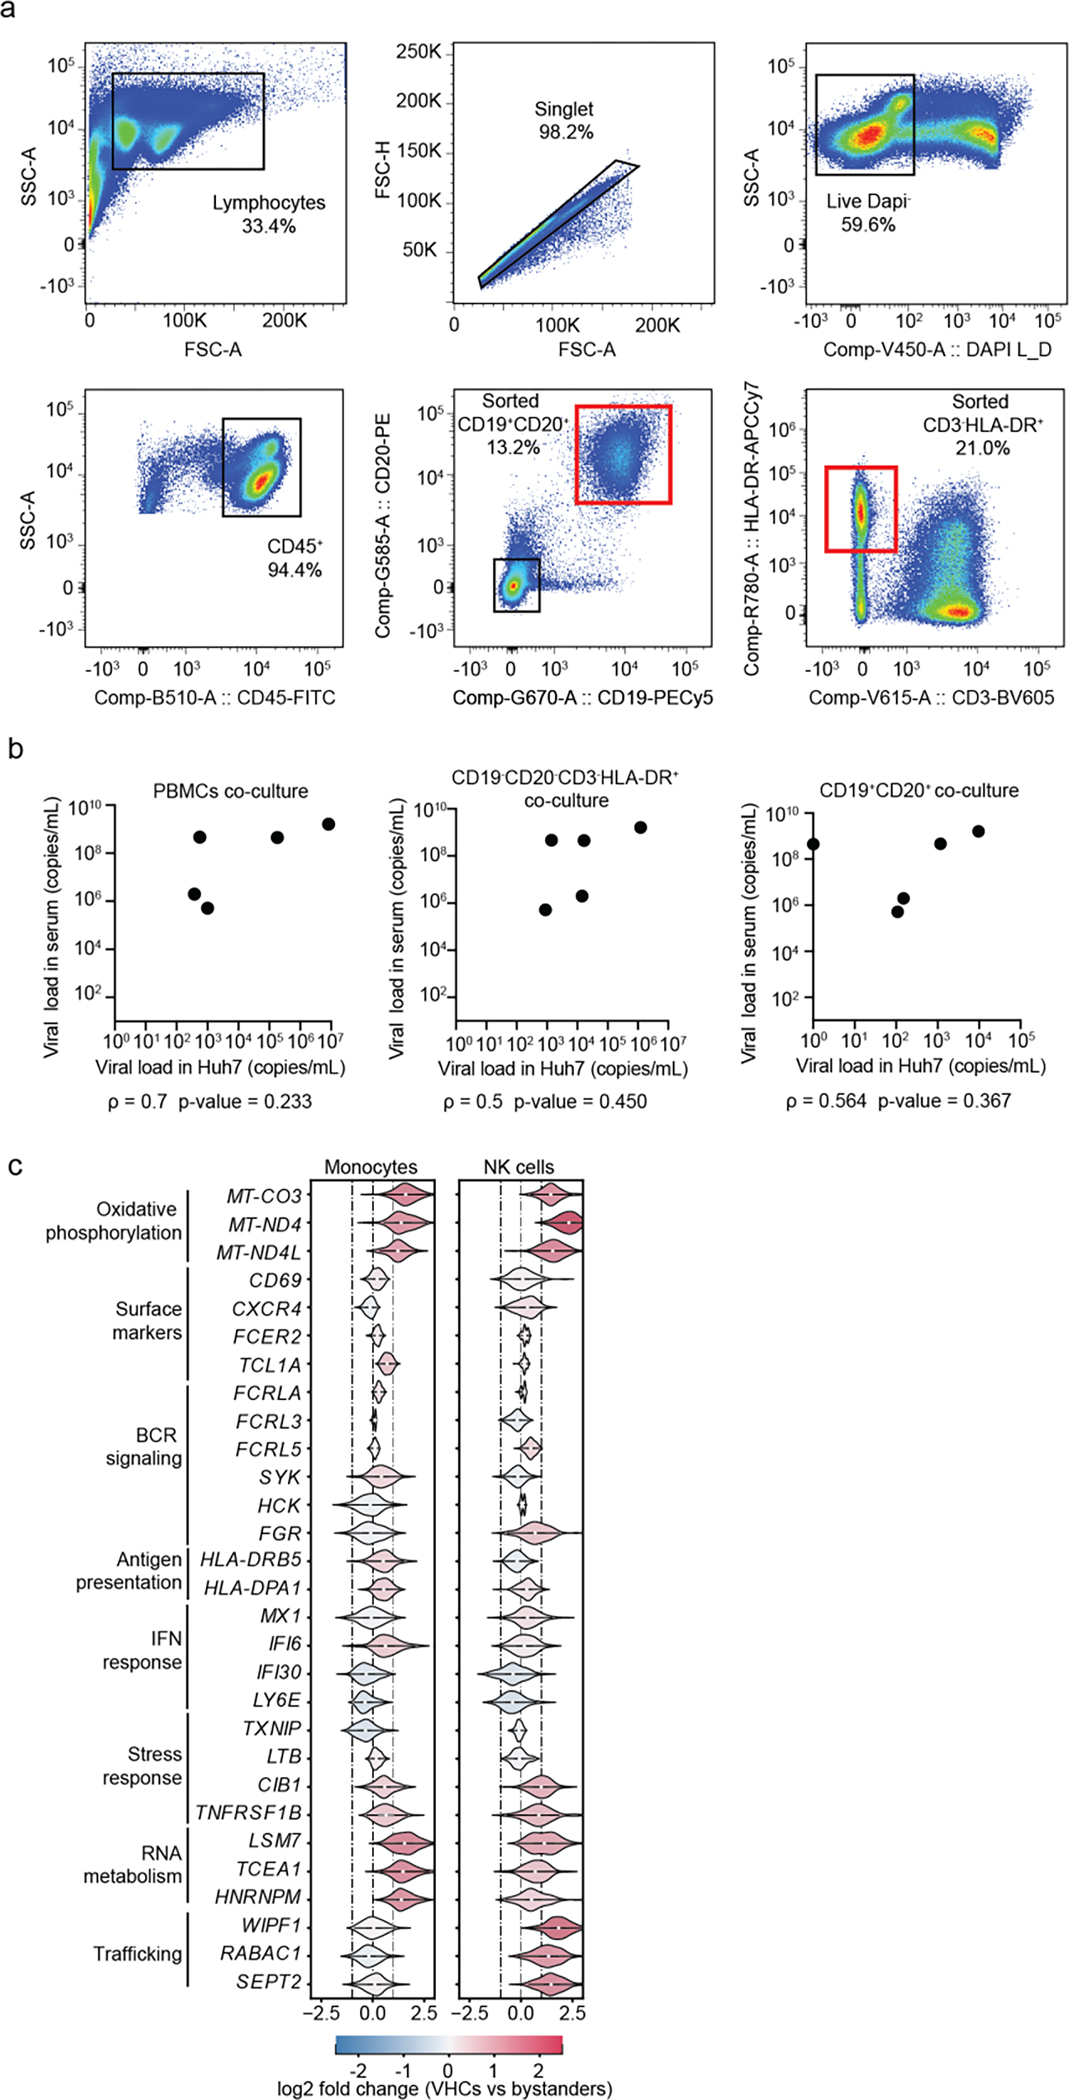
Fig.7: Gating strategy and DEGs in VHCs vs. bystander cells.

a, FACS gating strategy used to sort populations of B cells (CD19+, CD20+) and CD19−CD20− CD3−HLA-DR+ cells for co-culture experiments. b, Scatter plots showing correlations between viral load in serum and viral load in Huh7 cell lysates (DENV copies /mL) following 5-day co-culture either with PBMCs or with CD19−CD20− CD3−HLA-DR+ and B cell (CD19+, CD20+) fractions from the same patients. Spearman correlation coefficients and p-values are shown below each panel. c, Violin plots showing log2 fold change of DEGs between VHCs and corresponding bystander monocytes and NK cells in 3 DWS patients with highest vRNA reads shown in Fig.4a. DEGs were identified by the median log2 fold change of 100 bootstrapped comparisons between VHCs and equal numbers of subsampled bystander cells. Note large noise driven by the small number of viral reads in these cell subtypes.
