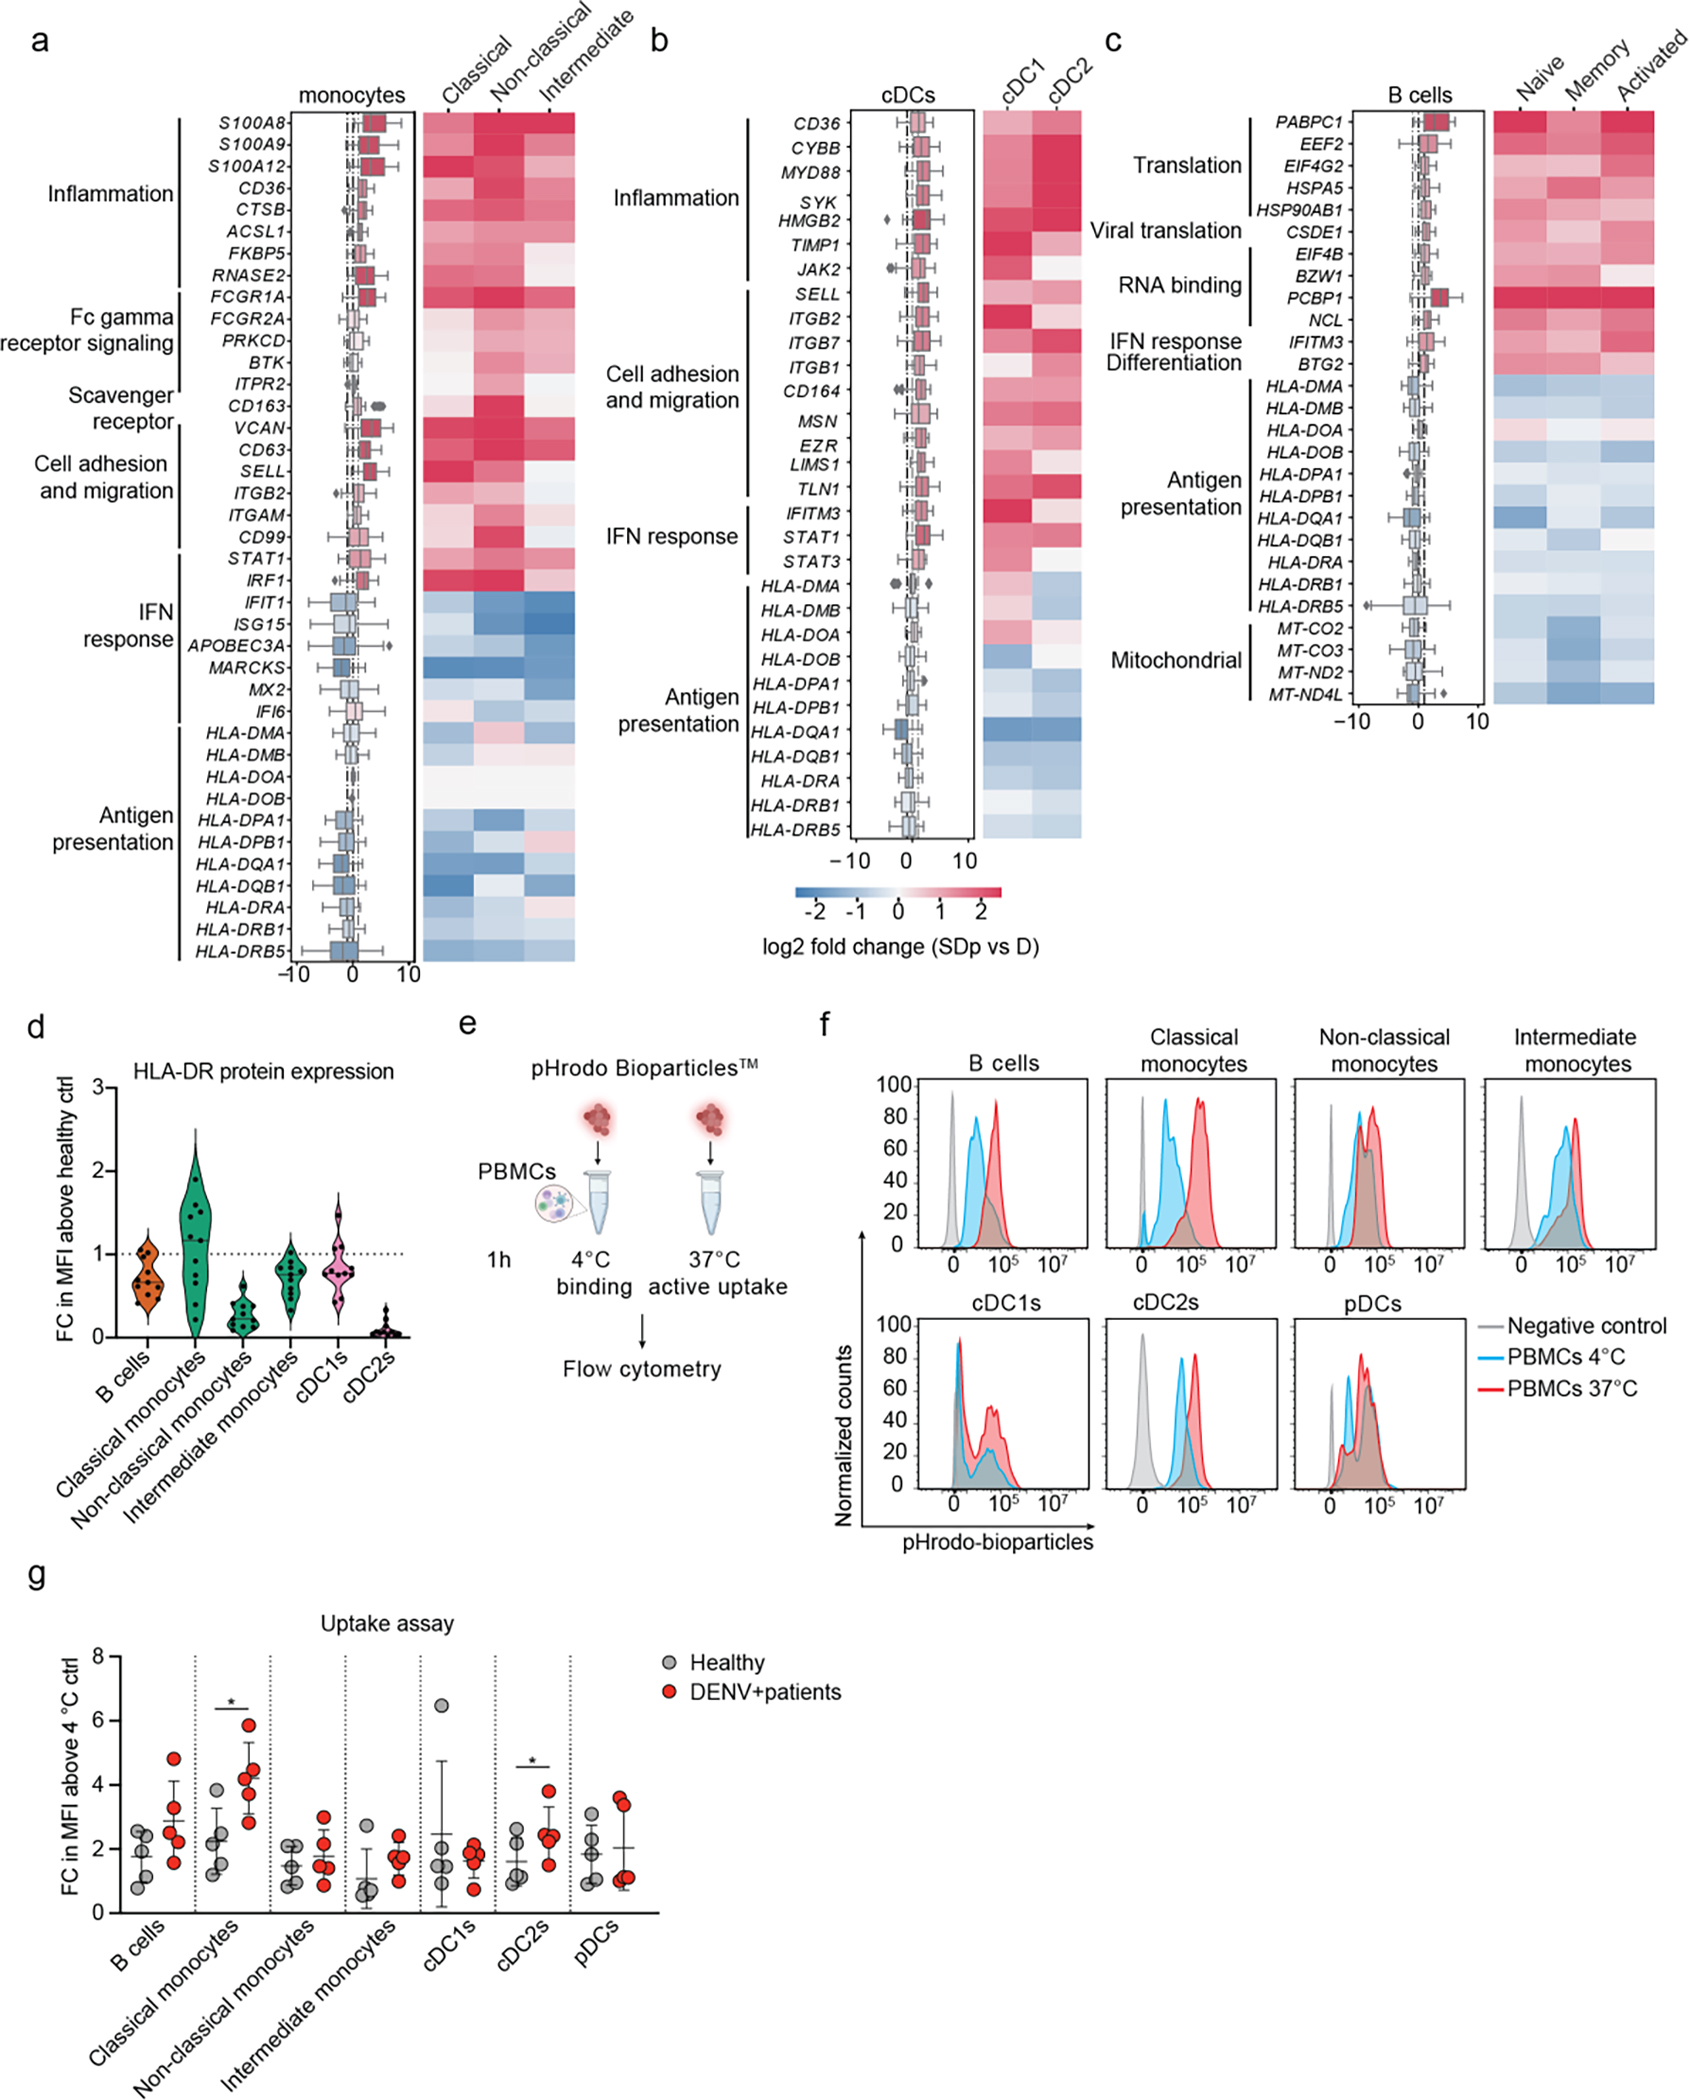
Fig.2: Immunological determinants of SD progression in patient-derived antigen presenting cells (APCs).

a-c, Differentially expressed genes (DEGs) between D and SDp detected via pairwise comparison of patients’ average (see Methods) in monocyte (a), cDC (b) and B cell (c) populations (Box plots, left) and the corresponding distinct cell subtypes (heatmaps, right). Data are color-coded based on median log2 fold change of pairwise comparisons. Box plots’ horizontal lines indicate the first, second (median) and third quartiles. Whiskers extend to ±1.5 × IQR. n = 15 participants: D (n = 8); SDp (n = 7). d, Violin plot showing HLA-DR cell surface expression measured via spectral flow cytometry in patient-derived PBMCs expressed as fold change (FC) of mean fluorescence intensity (MFI) above healthy control. Dotted line represents mean value of healthy controls normalized at value 1. Horizontal lines in violin plots represent median. n =11 paticipants from 2 independent experiments. e, Schematic of the uptake experiments shown in panels f and g. Patient-derived PBMCs were incubated for 1 hour either at 4 °C or 37 °C with pHrodo Bioparticles followed by fluorescence measurement via spectral flow cytometry. f, Representative histograms showing the percentage of pHrodo Bioparticles positive cells in distinct cell subtypes derived from a healthy individual incubated with no bioparticles (grey) or with bioparticles at 4 °C (cyan) or 37 °C (red). g, Bioparticle uptake quantification in the indicated cell subtypes shown as FC of mean MFI above the corresponding 4 °C control. Each dot represents a participant, color-coded by disease severity: H (gray, n = 5); DENV-infected (red, n = 5), from two independent experiments. Error bars represent mean values ± SD. p values by two-tailed Mann-Whitney test are shown.
