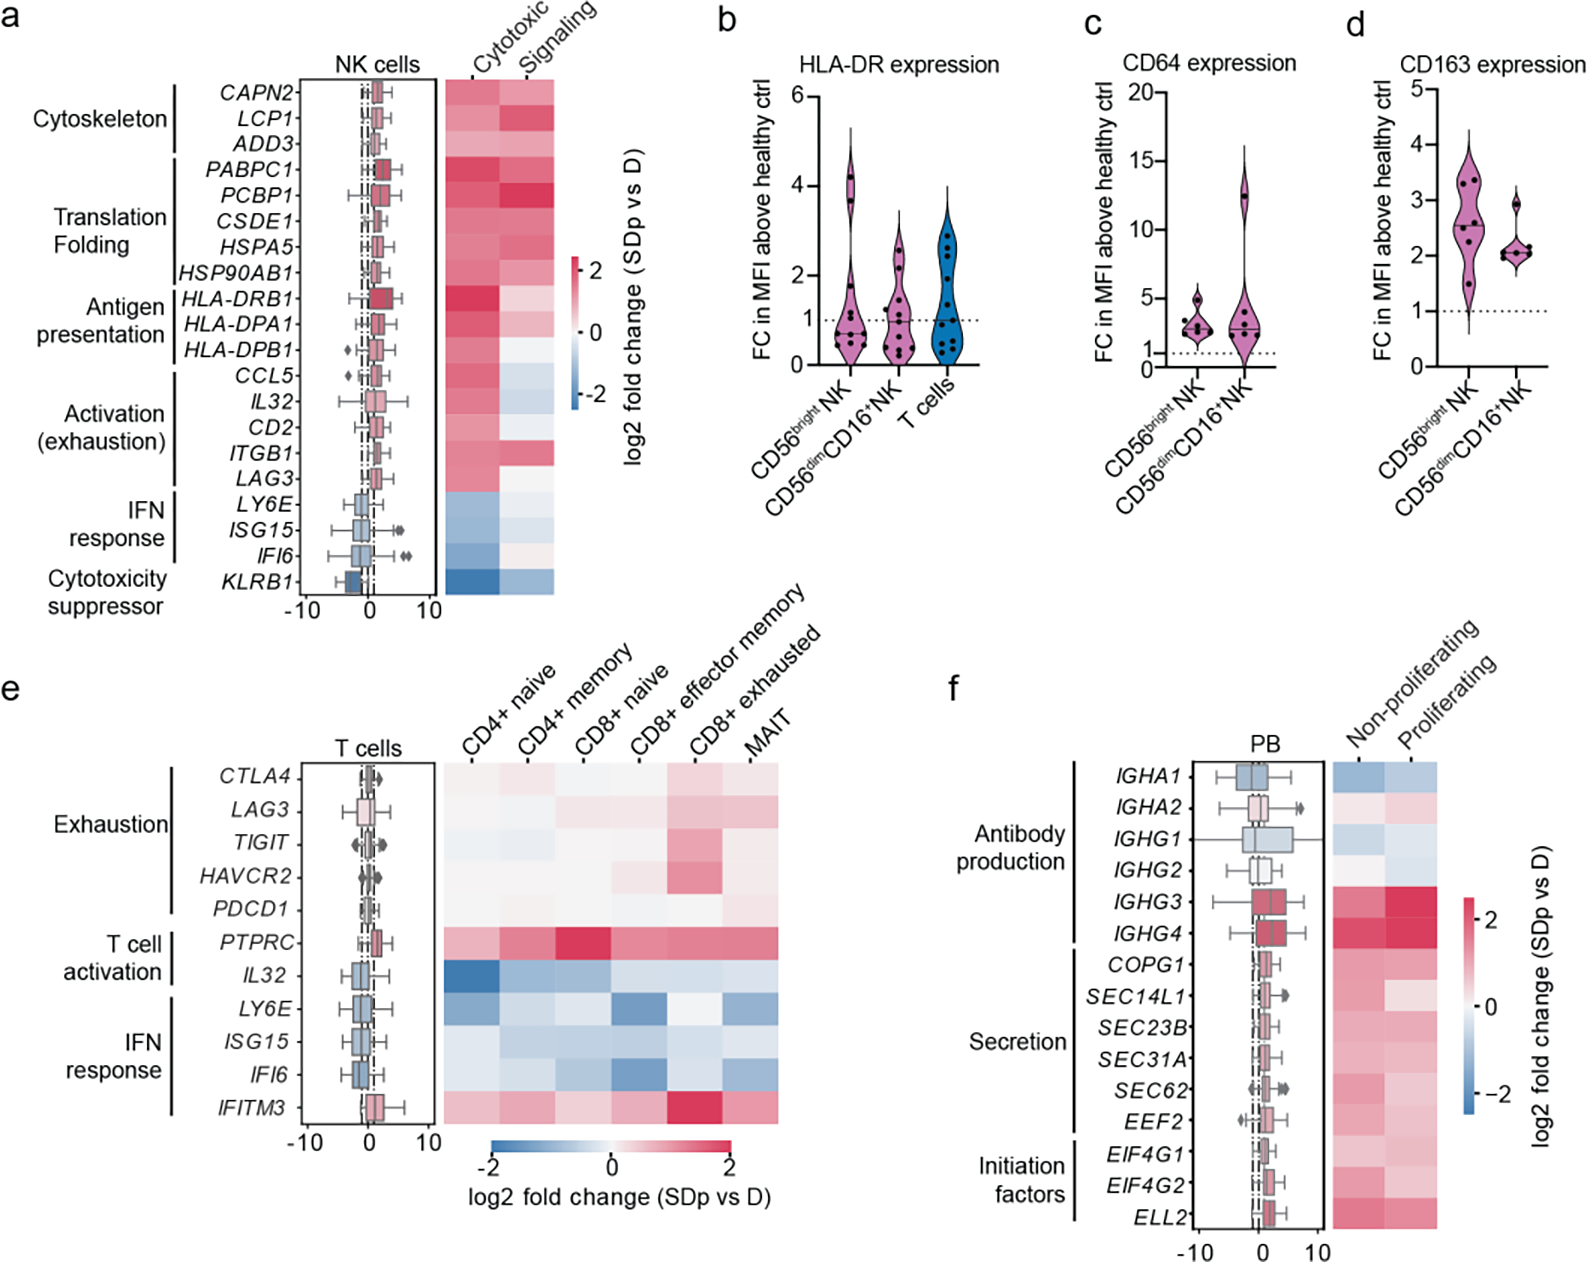
Fig.3: Phenotypic alterations in effector cells associated with SD progression.

a, e, f, DEGs between D and SDp detected via pairwise comparison of patients average in NK cell (a) T cell (e) and plasmablast (f) populations (Box plots, left) and distinct corresponding cell subtypes (heatmaps, right). Data are color-coded based on median log2 fold change of pairwise comparisons. Box plots’ horizontal lines indicate the first, second (median) and third quartiles. Whiskers extend to ±1.5 × IQR. The heatmap for Tregs (e, starred) was computed using group averages instead of patient averages due to their low abundance. n = 15 participants: D (n = 8); SDp (n = 7). b-d, Violin plots showing cell surface expression of HLA-DR (b) CD64 (c) and CD163 (d) measured in patient-derived NK (b-d) and T cells (b) via spectral flow cytometry expressed as fold change (FC) of mean fluorescence intensity (MFI) above healthy control. Each dot represents a participant [n = 11 (b); n = 6 (c, d)] from two independent experiments. Dotted lines represent mean values of healthy controls normalized at value 1; horizontal lines in violin plots represent median. These measurements were conducted side-by-side with those shown in Fig. 2d.
