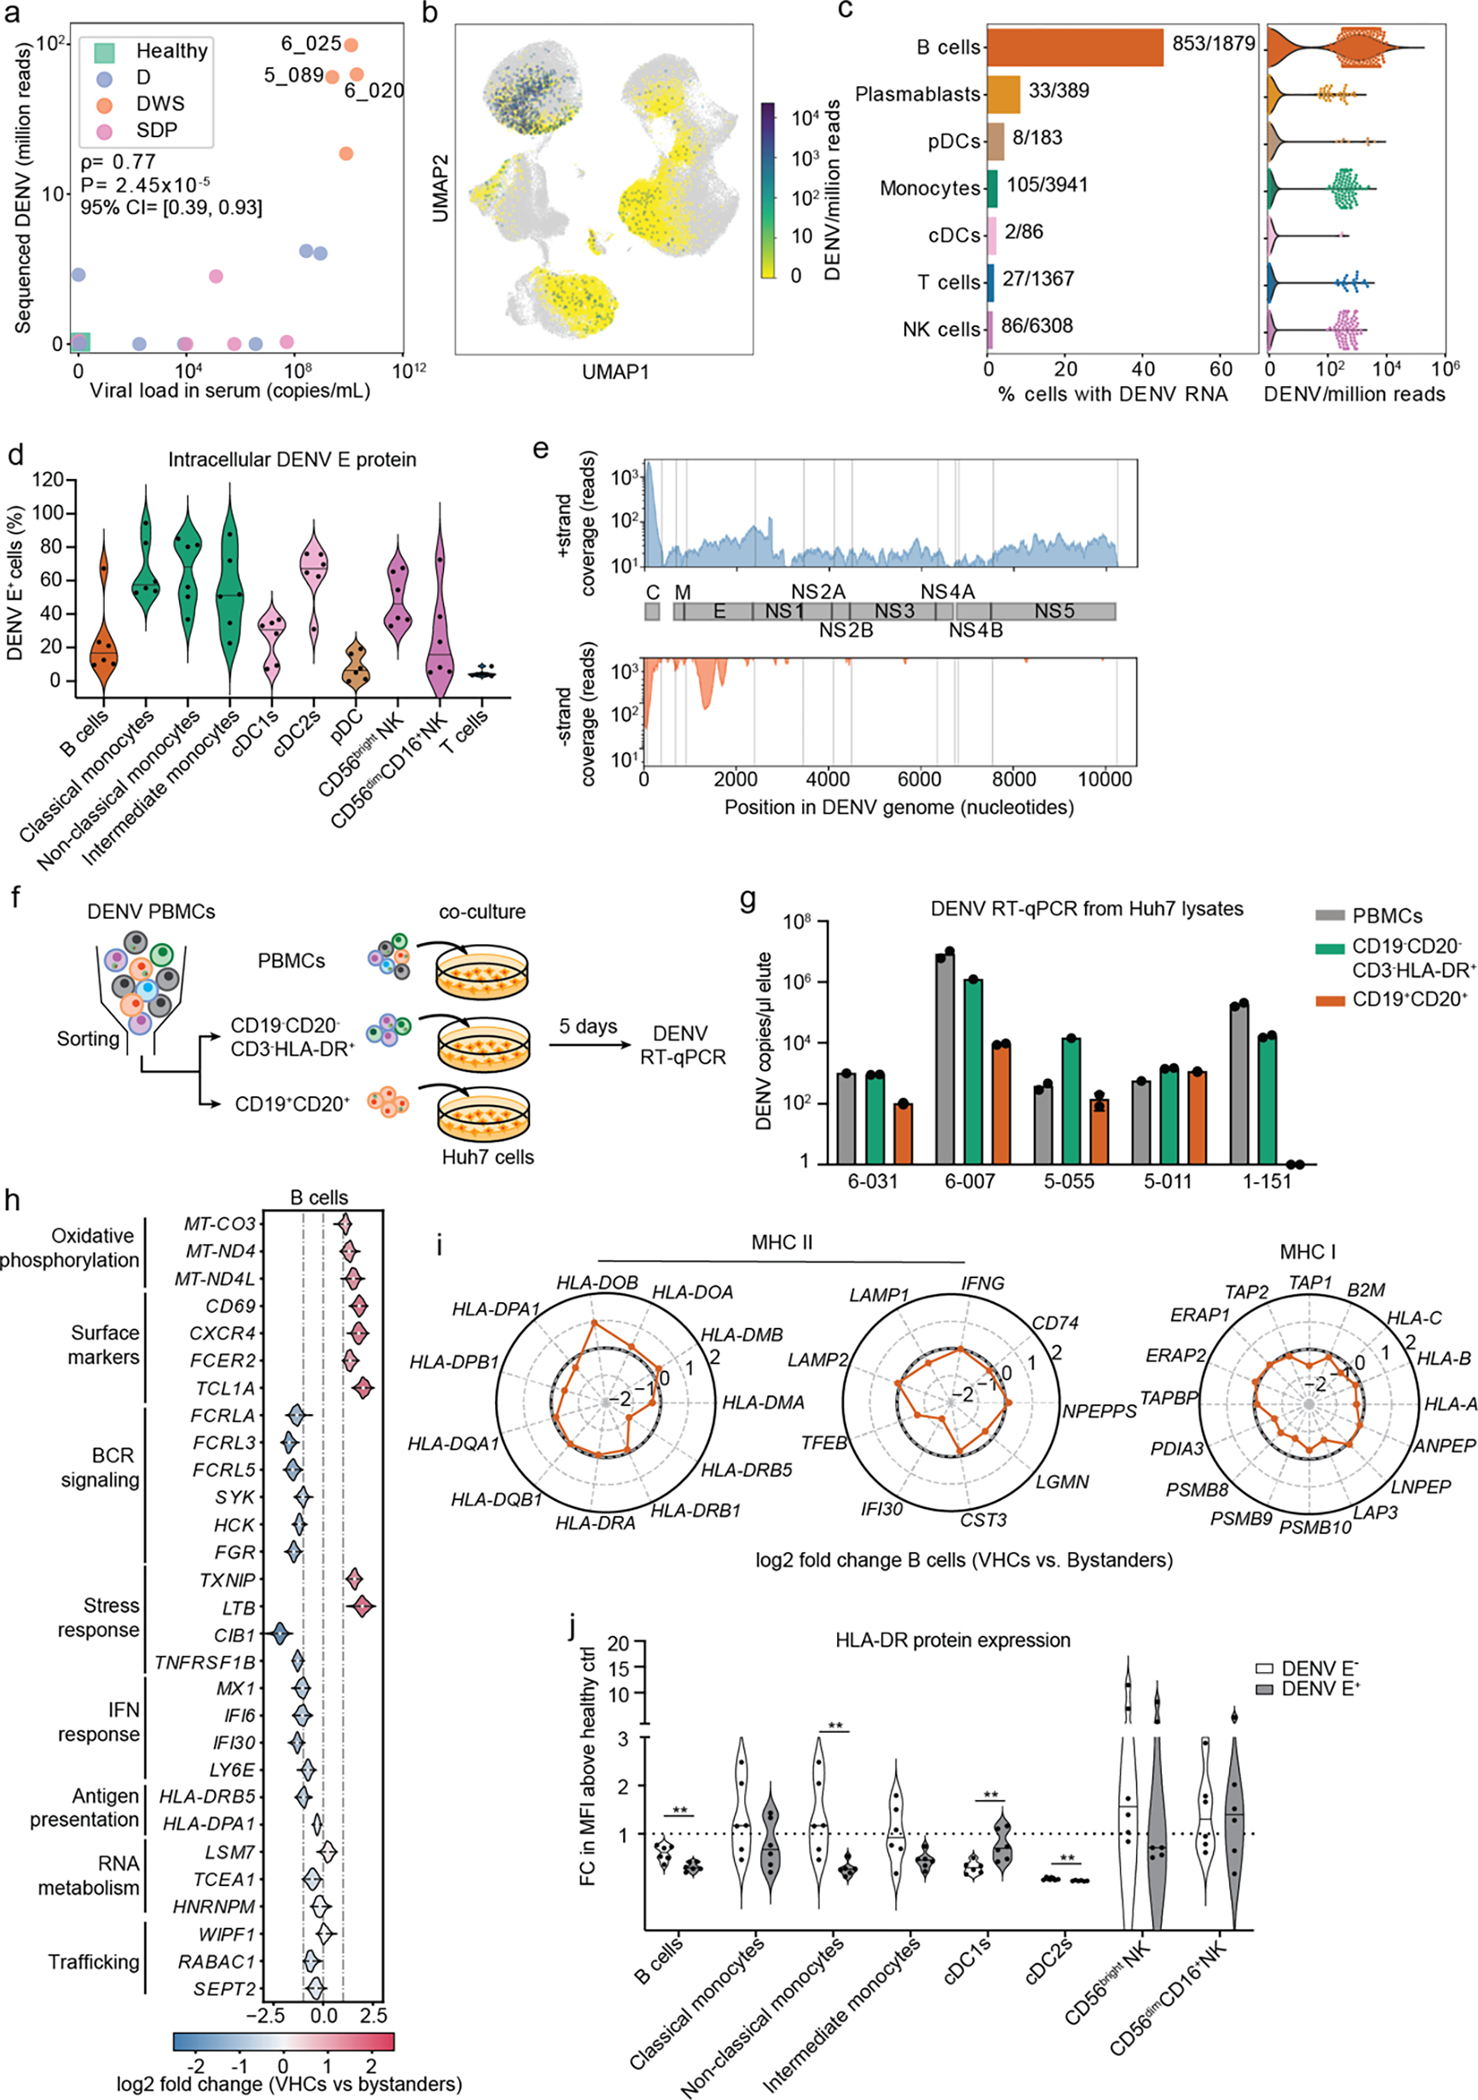
Fig.4: DENV actively replicates in patient-derived B cells and alters their transcriptional profile.

a, Scatter plot of normalized DENV reads measured in PBMCs by viscRNA-Seq 2 vs. serum viral load measured by RT-qPCR (two-tailed Spearman correlation coefficient ρ=0.76, p value=1.86e-5; 95% confidence interval were computed using bootstrapping strategy). Each dot represents a participant, color-coded by disease severity: H - green; D - blue; DWS - orange; SDp - pink. Sample IDs are shown for the three DWS patients with highest DENV read counts. b, UMAP color-coded by DENV reads per million reads (cpm) of the three patients labeled in a. c, Fraction of VHCs from the total (bar plot, left panel) and distribution of DENV read per million reads (violin plots, right panel) in the indicated immune cell types from the three patients labeled in a. d, Violin plot depicting the percentage of DENV E positive cells in B cells (CD19+), classical monocytes (CD14+CD16−), non-classical monocytes (CD14−CD16+), intermediate monocytes (CD14+CD16+), cDC1s (CD141+), cDC2s (CD1c+), pDCs (CD123+CD303+), CD56bright NK cells, CD56dimCD16+ NK cells, and T cells from the indicated DENV-infected DWS patients with viremia ranging from 105 to 109 viral copies/mL measured via spectral flow cytometry. e, Coverage of detected positive (+ strand) and negative (− strand) vRNA strands along the DENV genome. f, Schematic of the co-culture experiments shown in g. g, Bar plot showing DENV RNA copies per μL measured via RT-qPCR in Huh7 lysates following a 5-day co-culture with patient-derived total PBMCs (gray), or HLA-DR+ (CD19−CD20− CD3−HLA-DR+ cells, green) and B cell (CD19+CD20+, orange) fractions isolated from the same five DWS patients). Data are combined from two independent experiments (n = 5 participants). Dots represent technical replicates. h, Violin plots showing log2 fold change of DEGs between VHCs and corresponding bystander B cells in three DWS patients with highest vRNA reads shown in Fig.4a. DEGs were identified by the median log2 fold change of 100 comparisons between VHCs and equal numbers of random corresponding bystander cells. i, Radar plot showing log2 fold change of selected genes associated with MHC II and MHC I pathways between VHCs and corresponding bystander cells in B cells. j, Violin plot showing cell surface expression of HLA-DR in DENV+ and DENV− fractions, identified via DENV envelope immunolabelling of B cells, monocytes, DCs and NK cells measured via spectral flow cytometry and displayed as fold change (FC) of mean fluorescence intensity (MFI) above healthy control. Data combined from two independent experiments are shown in panels d [n = 11: DWS (n = 6); healthy controls (n = 5)] and j (n = 6). P values by two-tailed Mann-Whitney test are shown in panel J.
