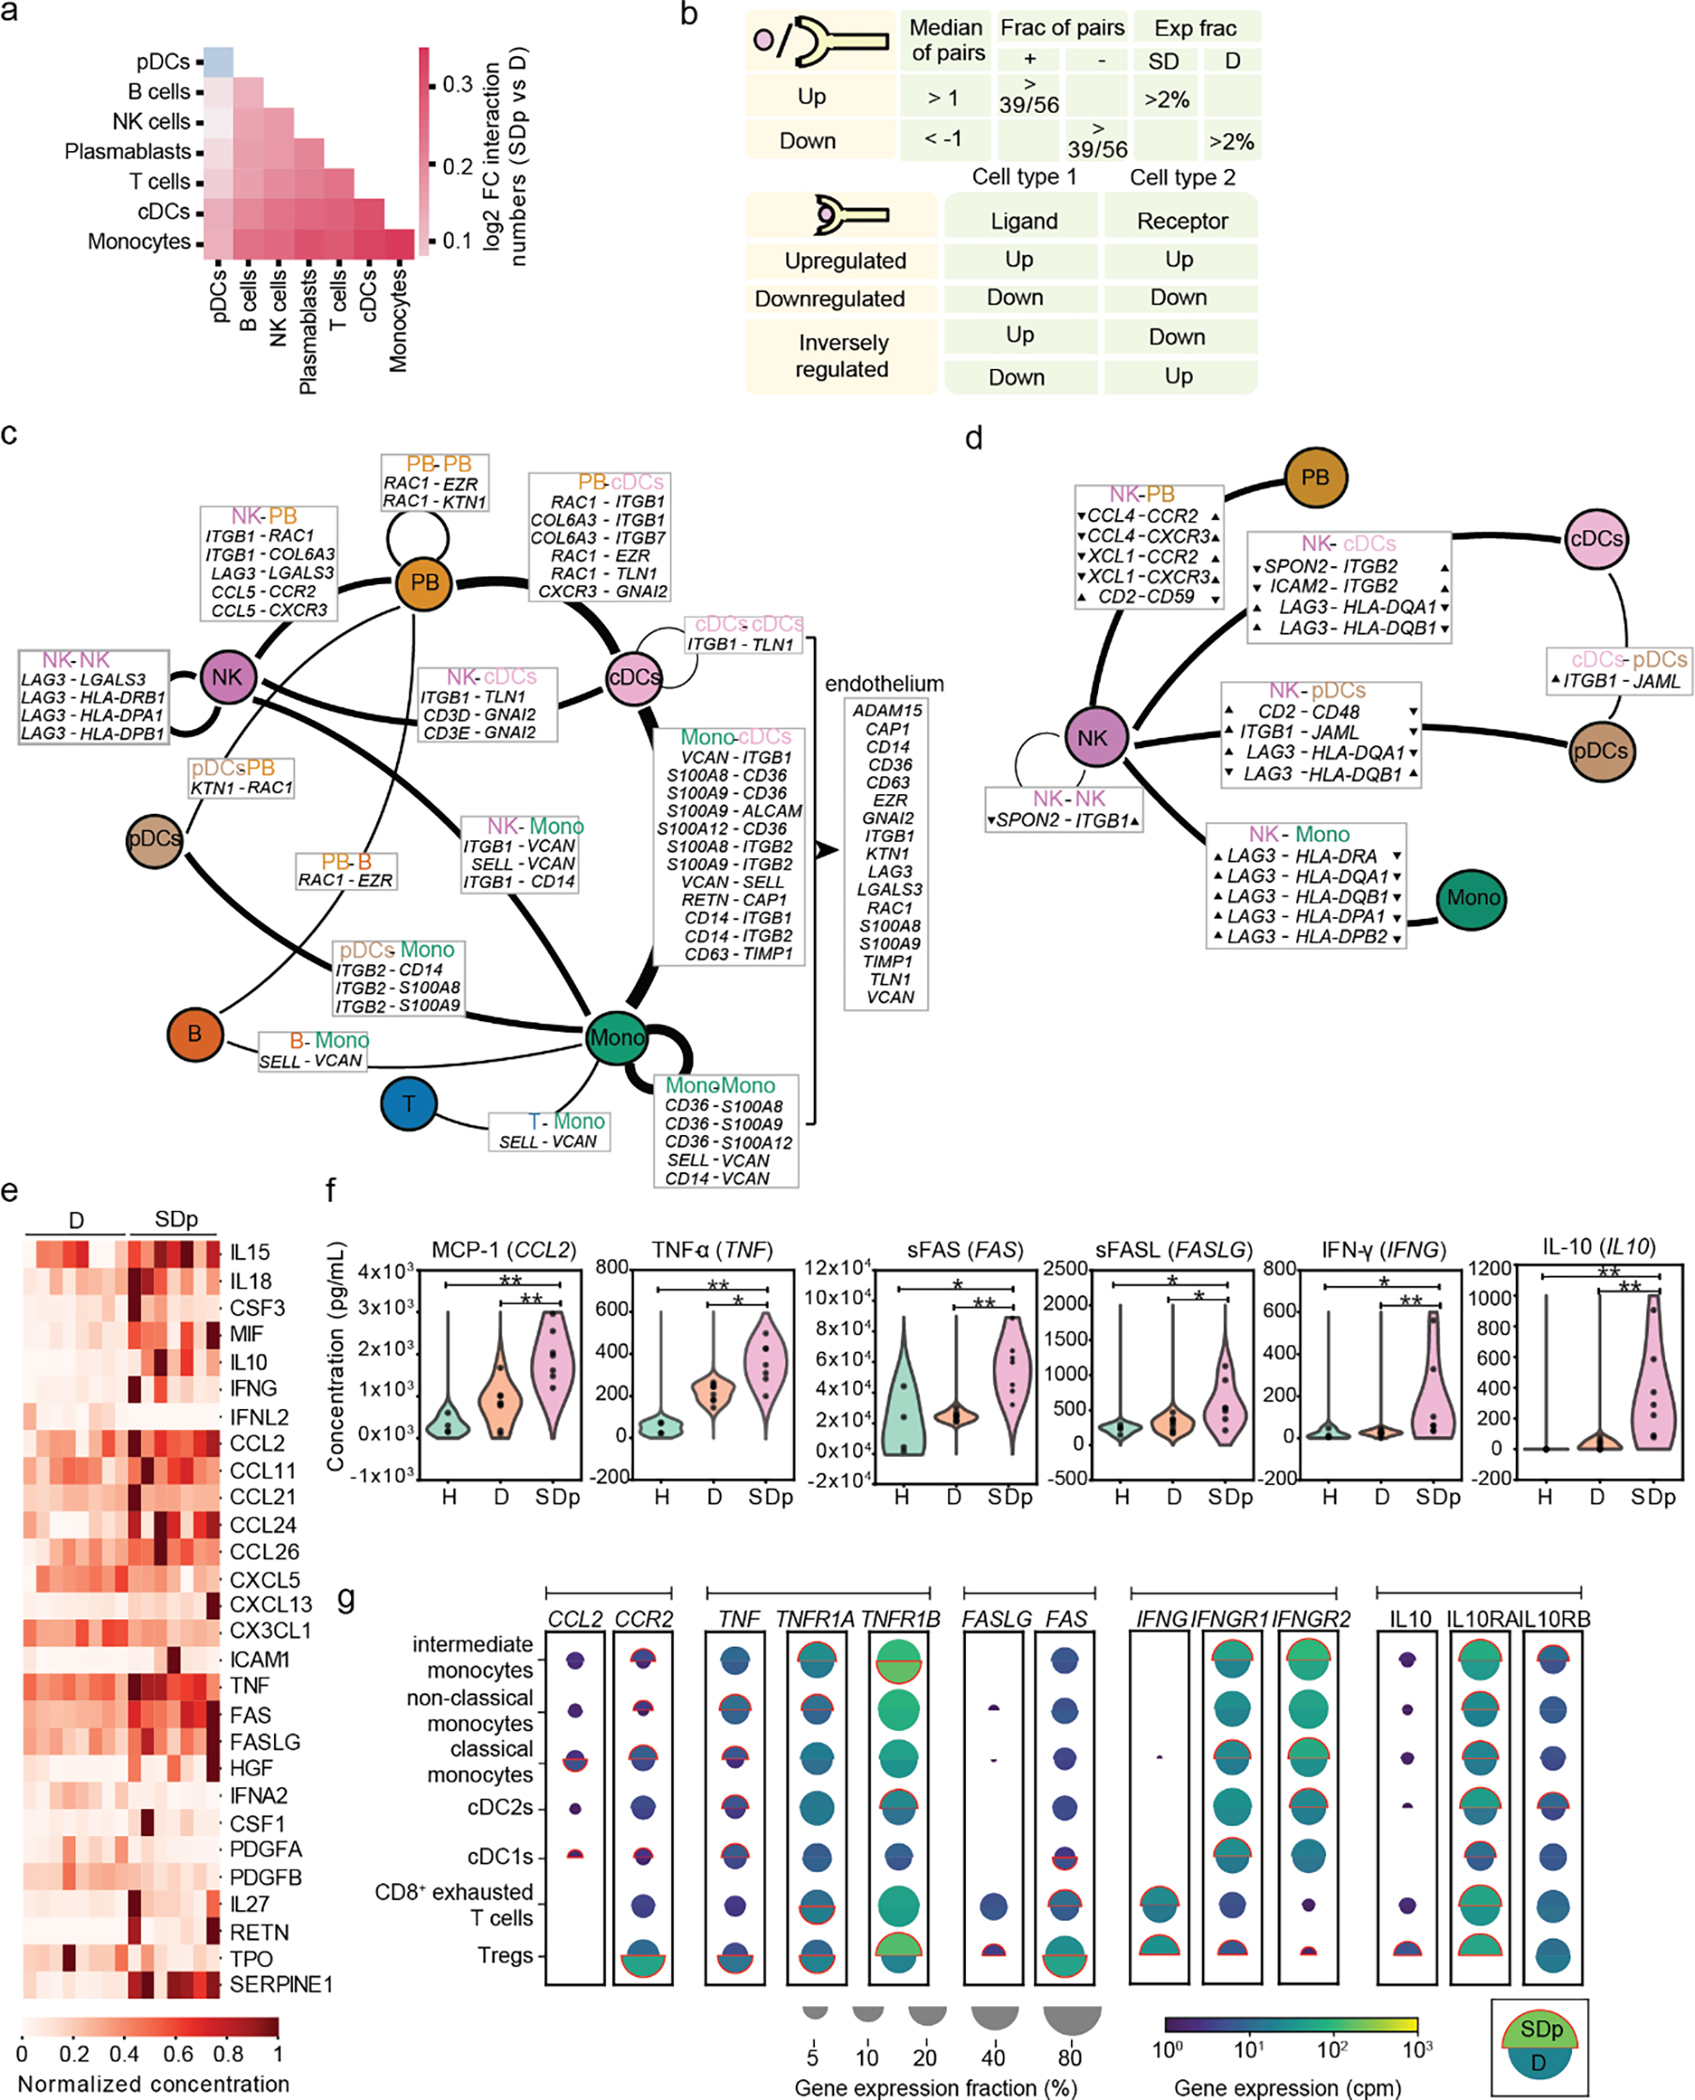
Fig.5: Cell-cell communication and cytokine production are increased in SDp.

a, Heat map showing the log2 fold change in number of candidate interactions between SDp and D children defined by expression of both the ligand and receptor in at least 2% of cells within each cell type. b, Schematic showing the parameters for identifying interacting partners and (top), and the classification of DEIs (bottom). c, d, Interaction networks of upregulated (c) and inversely regulated (d) DEIs in SDp vs. D. Circles indicate cell types; lines indicate interaction partners with thickness representing the number of interactions; text boxes specify genes involved in identified candidate interactions and the cell types expressing them, including candidate interactions with endothelium based on Tabula Sapiens data (right panel in c); and arrowheads (in d) depict up- and down-regulation of the indicated genes. e, Heatmap showing serum concentrations of 27 differentially secreted cytokines (out of 80 tested) between SDp vs. D normalized to the highest corresponding concentration. f, Violin plots of serum concentration (pg/mL) of top differentially secreted cytokines in SDp vs. D. g, Split dot plots showing the expression level of transcripts of cytokines (corresponding to those in (f)), and cognate receptors measured via viscRNA-Seq 2. Top half of each split dot plot depicts the expression level in SDp; bottom half depicts the expression level in D; size depicts the percentage of gene expressing cells in the cell types indicated on the left; and color depicts gene expression level in counts per million (cpm). Red outline indicates the condition with the higher gene expression. Data in panels e and f are from n = 19 participants: H (n = 4), f only; D (n = 8); SDp (n = 7). p values by two-tailed Mann-Whitney test are shown in panel f.
