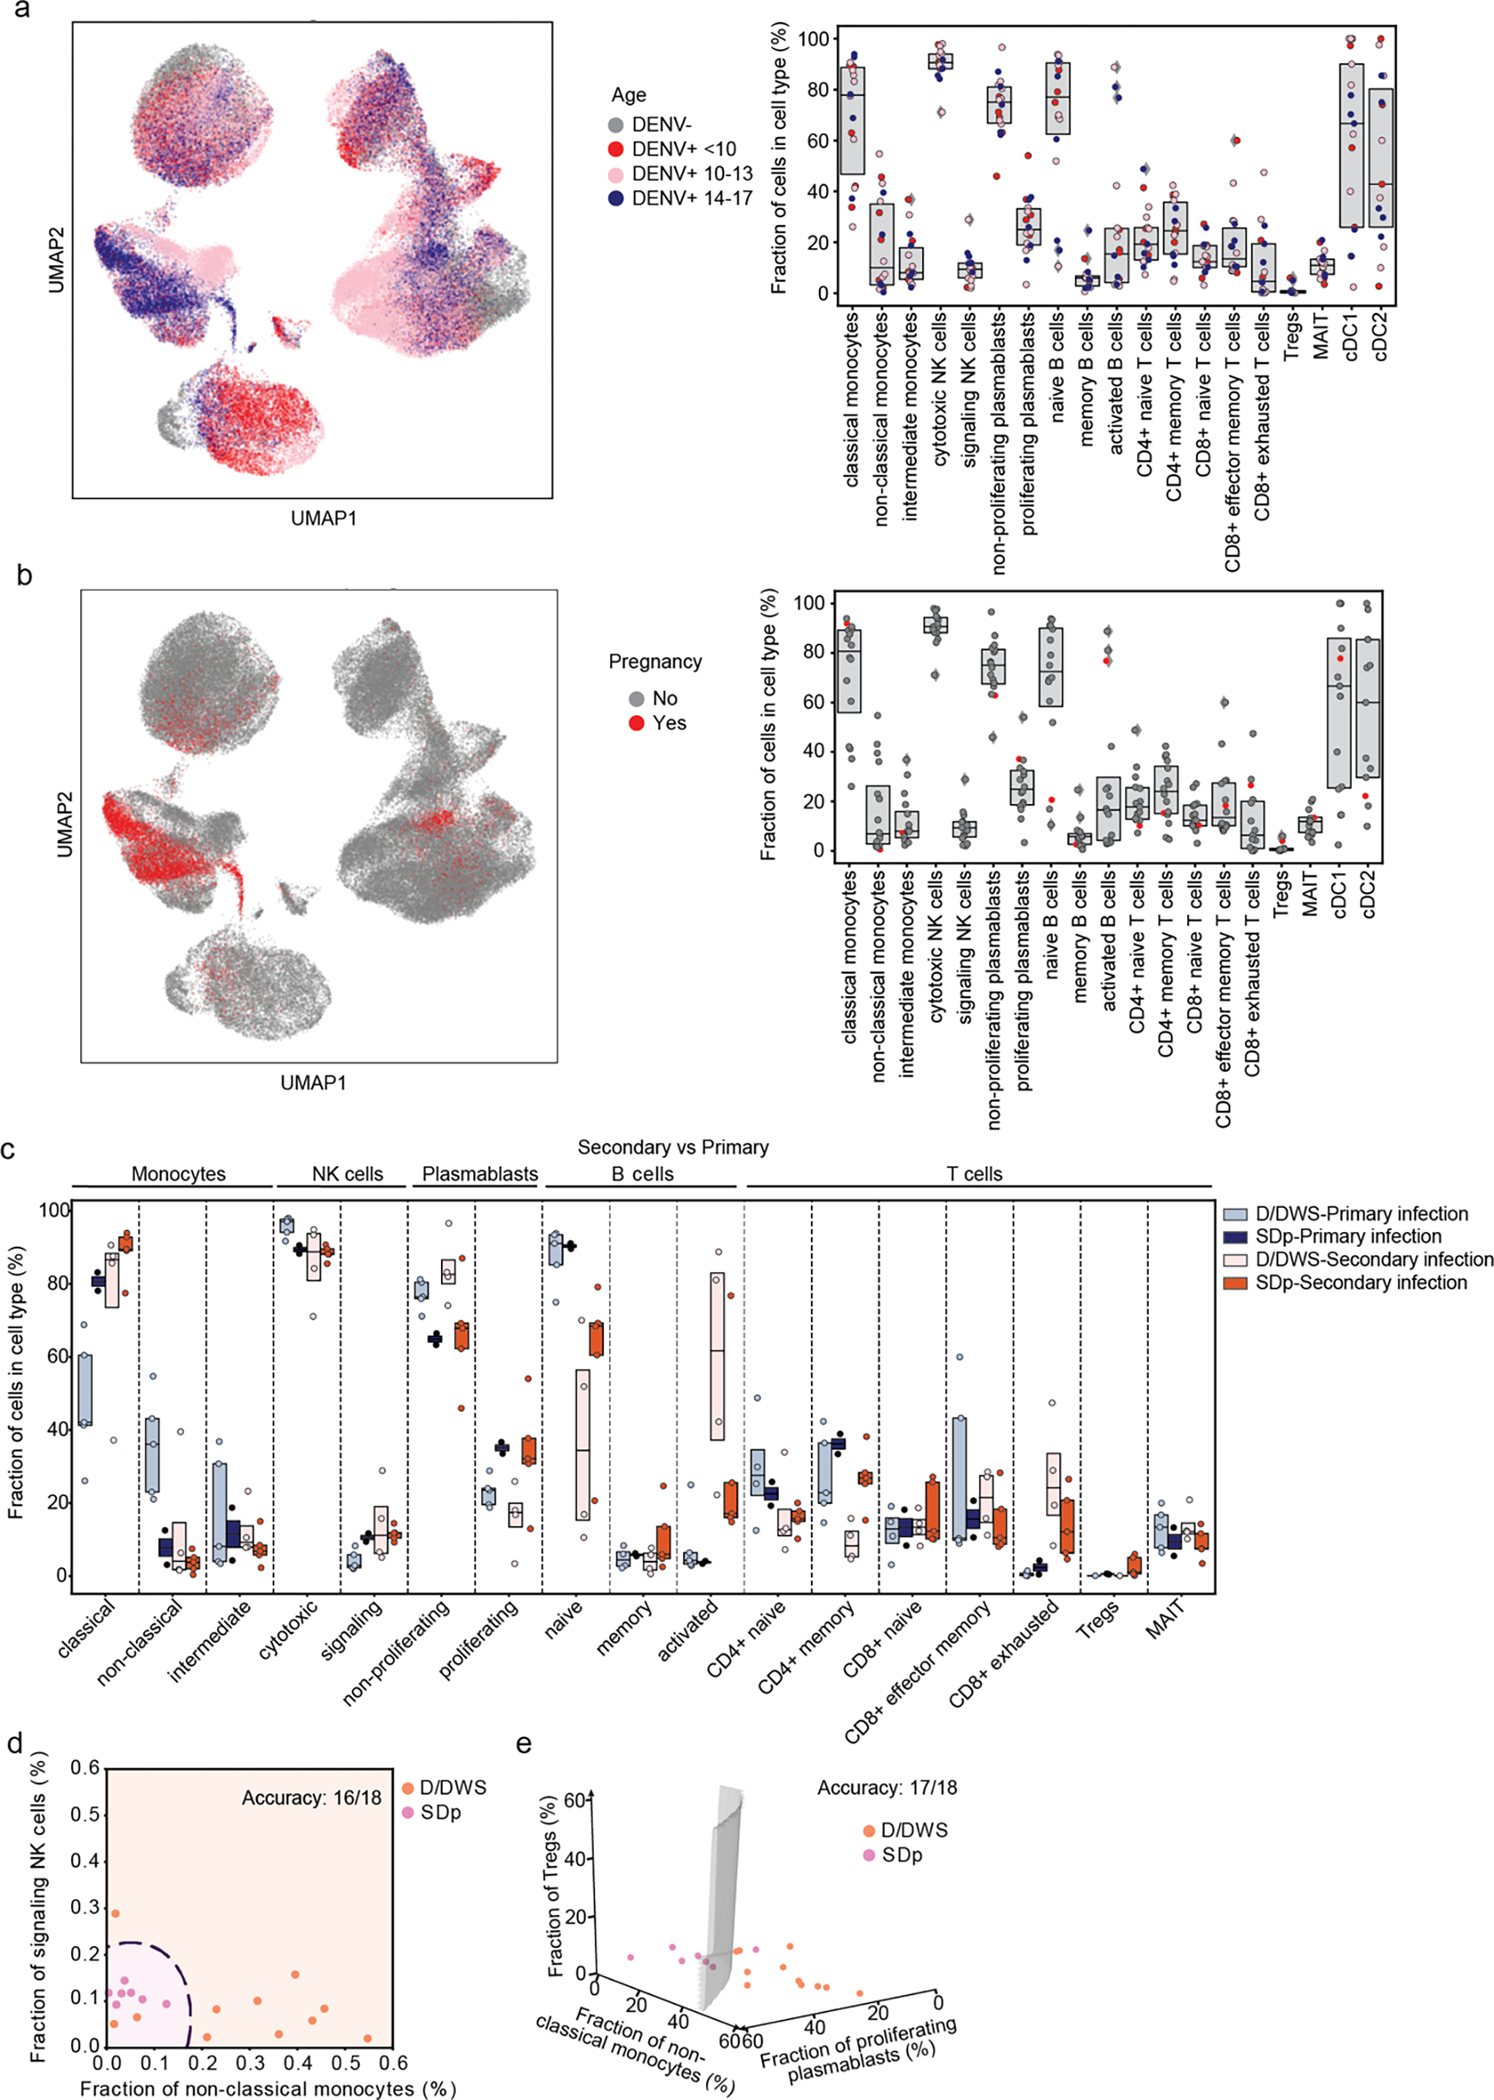
Fig.2: Alterations in cell type abundance are independent of age and pregnancy status and are partially associated with prior DENV exposure.

a, UMAP of the entire dataset (left panel) and box plots showing the fractions (%) of cell subtypes within each major immune cell type (right panel) color-coded by patients’ age (in years): <10 =red; 10–14 =pink; 14–17 =blue years old. Box plots’ horizontal lines indicate the first, second (median) and third quartiles, each dot Each dot represents an individual. b, UMAP (left panel) and box plots (right panel) showing distribution and fraction of cells (%) color-coded by pregnancy status, pregnant= red, non-pregnant= gray. c, Box plots showing the fractions (%) of cell subtypes within each major immune cell type by disease severity (SDp and D/DWS) and DENV exposure (primary and secondary). Each dot represents an individual, color-coded by disease severity and DENV exposure (D/DWS-primary =light blue; SDp-primary= dark blue; D/DWS-secondary= light orange; SDp-secondary= dark orange). Box plots’ horizontal lines indicate the first, second (median) and third quartiles. d,e Two (c)- and three (d) dimensional Support Vector Machine (SVM) classifiers for SDp versus D/DWS using the fraction of cells indicated on the axes. Accuracy is evaluated using leave-one-out cross-validation. For this prediction, we trained a support vector machine (SVM) regression model with a third-degree polynomial kernel using the class NuSVC in scikit-learn. We chose SVMs partly because they have a straightforward geometrical interpretation as one can directly plot the hypersurface with the nullcline of the decision function (black dashed curve in d and gray surface in e).
