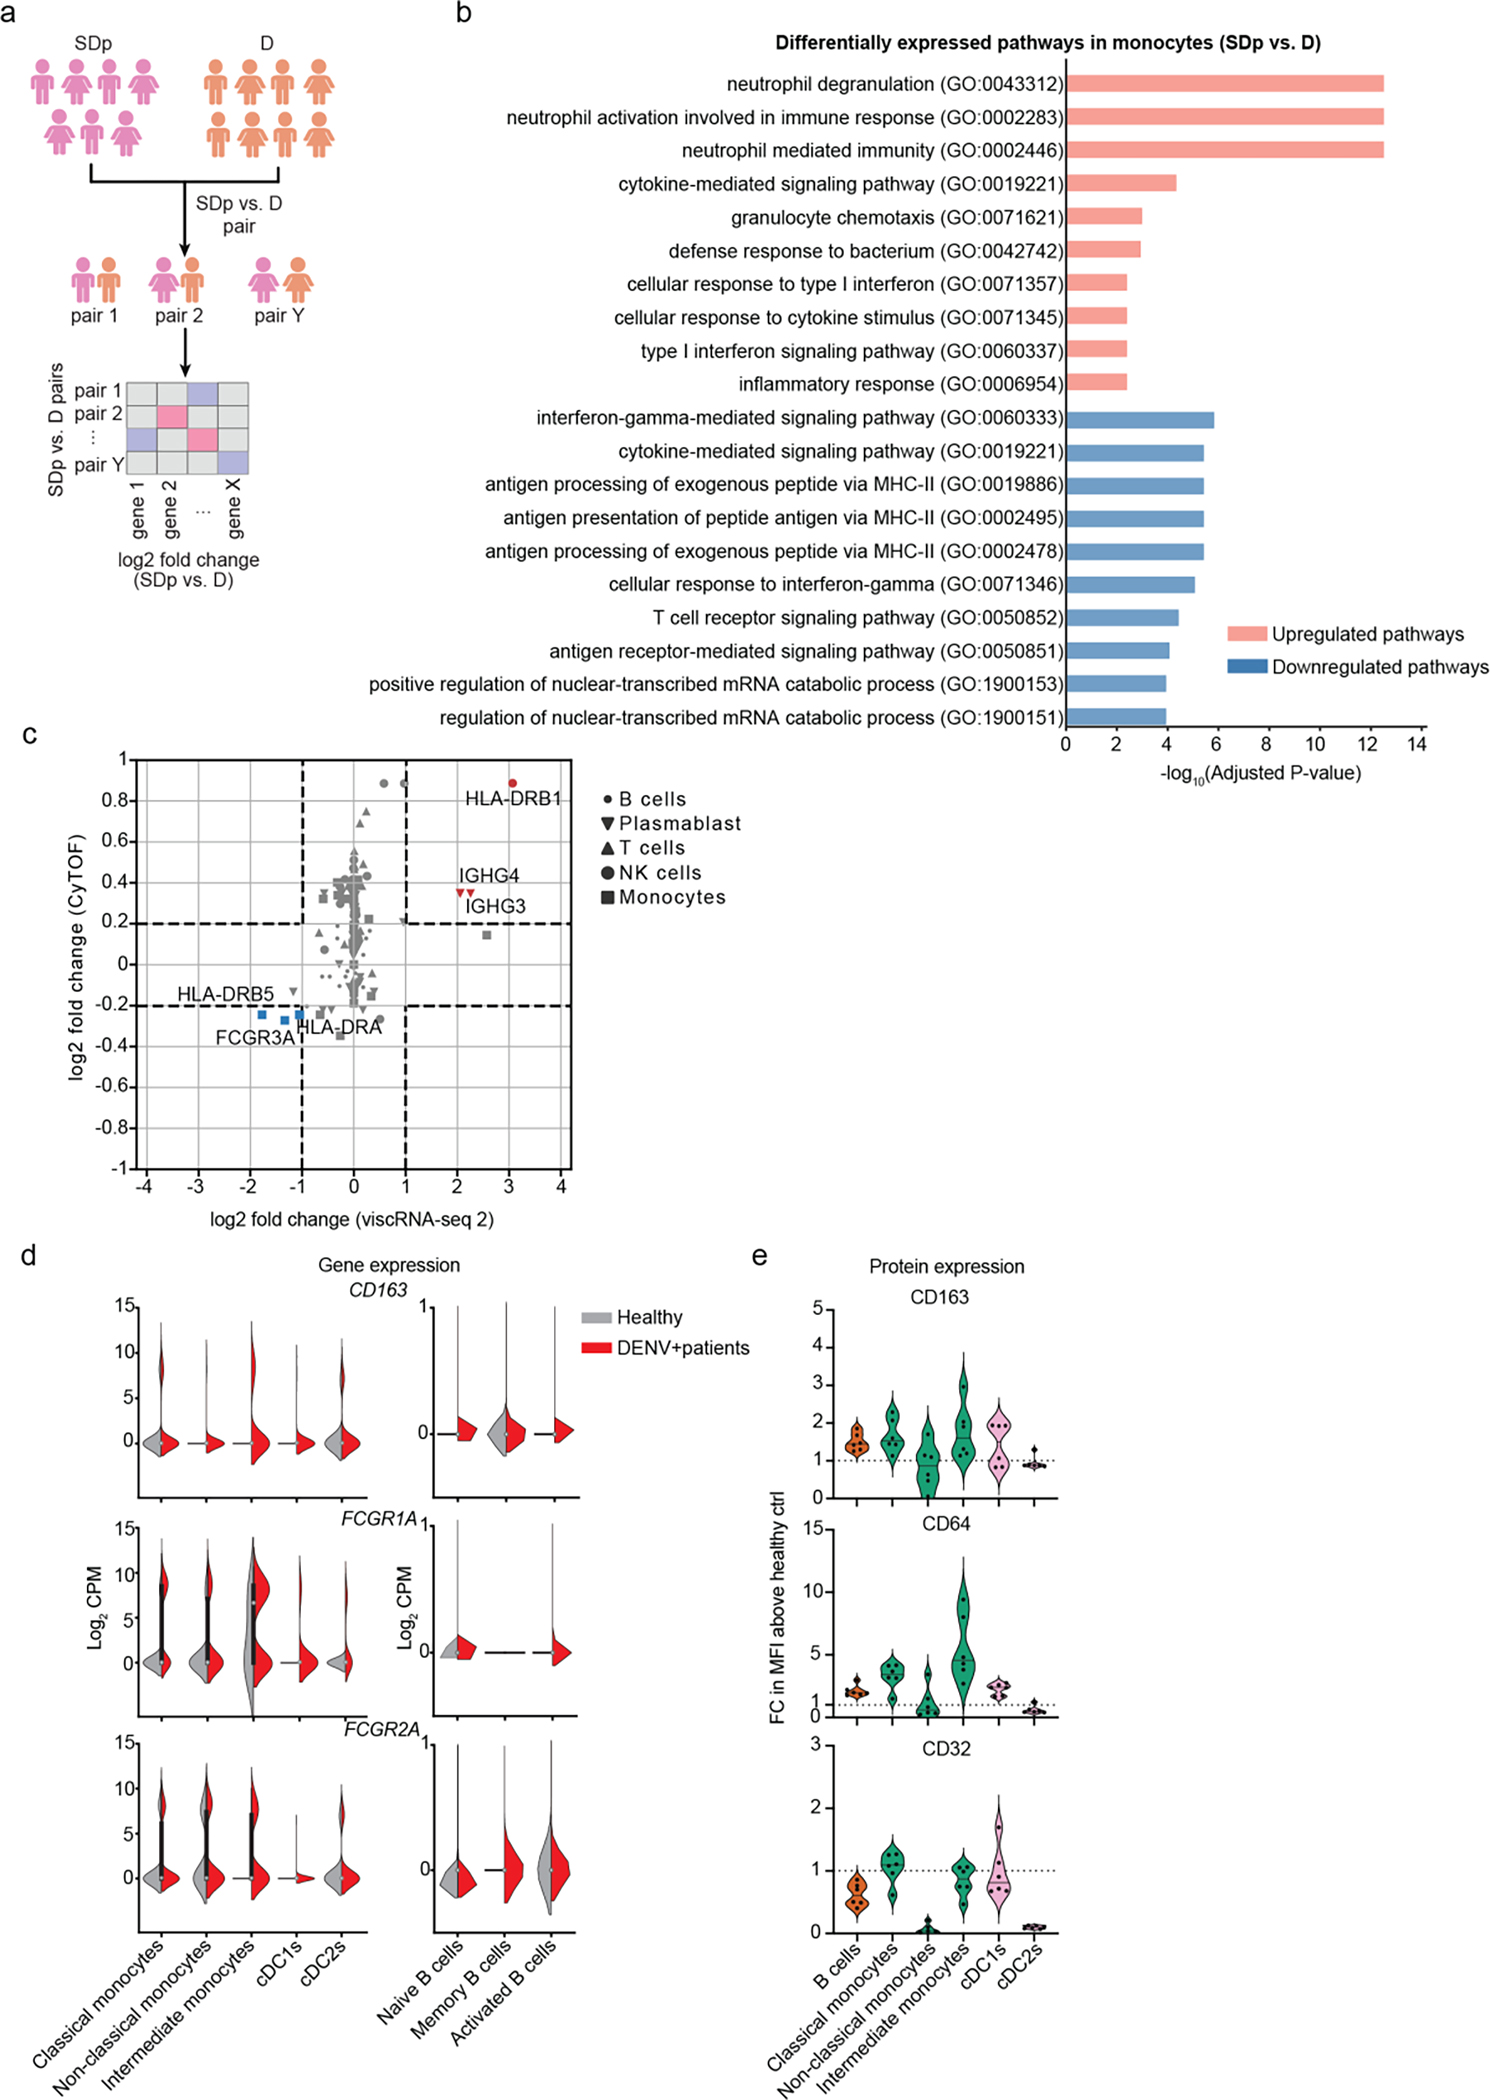
Fig.3: APCs from SDp show signatures of increased activation but decreased antigen presentation.

a, Schematic illustrating the pairwise comparison strategy used to identify DEGs between SDp and D patients. Pairs were generated considering only patients that showed n≥5 cells in a cell type or n≥3 in a cell subtype. For each gene, we calculated the geometric mean expression in various cell subtypes for each patient in the pair and the log2 fold change in expression between the two patients in the pair. A median log2 fold change was then obtained for each gene by analyzing all pair combinations. DEGs were defined as those with a median log2 fold change greater than 1 or smaller than −1. b, Pathway analysis showing top 10 upregulated and downregulated gene ontology (GO) terms between SDp and D in monocytes. DEGs for downstream pathway analysis were identified by a 2-sample Kolmogorov-Smirnov test using anndataks 0.1.3. Genes with >1 log2 fold change between the two groups and a p-value <=0.05 (after FDR correction for multiple hypotheses). Metascape58 and GSEAPY59 open source software. were used for pathway analysis of groups of up- or downregulated genes. c, Scatter plots depicting log2 fold change in expression between SDp and D measured at the transcript level via viscRNAseq 2 (x axis) and at the protein level via CyTOF (y axis). Dashed lines depict the log2 fold change cutoffs (|log2 fold change| <1 in the viscRNA-seq dataset; |log2 fold change| < 0.2 in the CyTOF dataset). Shapes represent specific cell types. Each symbol represents a single cellular factor color coded based on the expression pattern (red – upregulated in both datasets; blue – downregulated in both datasets; gray – unaltered in the two datasets). Notably, in this reanalysis of the CyTOF dataset, samples from patients who presented with SD upon enrollment were excluded. d, Violin plots showing expression (Log2 CPM) of CD163, FCGR1A and FCGR2A in monocytes, cDCs and B cell subtypes in healthy (gray) and DENV+ patients including SD and D (red). e, Violin plots showing expression of CD163, CD64 and CD32 proteins on B cells (CD19+), classical monocytes (CD14+CD16−), non-classical monocytes (CD14−CD16+), intermediate monocytes (CD14+CD16+), cDC1s (CD141+) and cDC2s (CD1c+) measured via spectral flow cytometry in DWS patient-derived PBMCs. Data are shown as fold change (FC) of mean fluorescence intensity (MFI) above healthy control (n=6, N=2). Dotted line represents mean value of healthy controls normalized at value 1, horizontal line in each violin plot represents median value.
