. 2024 Feb 13;13:e83605. doi: 10.7554/eLife.83605

Figure 2. Single-molecule HIV capsid uncoating kinetics measured by TIRF microscopy.

(A) Schematic diagram of a viral particle at different stages of uncoating detected in the assay. HIV particles were produced using a proviral construct with internal GFP that is released from the viral Gag protein during maturation and packaged as a solution phase marker inside the two compartments bound by the viral membrane and the capsid, respectively. These GFP-loaded HIV particles are immobilised on the coverslip surface and permeabilised in the presence of AF568-labelled CypA while recording fluorescence traces at the locations of individual HIV particles by TIRF microscopy. Permeabilisation of the viral membrane (step a) with a pore-forming protein leads to loss of ~80–90% of the GFP signal corresponding to the pool of GFP outside the capsid. AF568-CypA molecules diffuse through the membrane pores and bind to the capsid to reach a level that is proportional to the number of CA subunits in the capsid. Capsid opening (step b) leads to loss of the residual GFP that is inside the capsid. CA lattice disassembly (step c) is apparent from the rapid loss of the CypA paint signal. (B, C) Example GFP release (blue-green) and CypA paint (magenta) traces for particles with capsids that are already leaky (i.e. contain defects and release all GFP in one step), undergo opening at various times after permeabilisation or remain closed throughout the observation period. In the absence of drug (B), the CypA paint intensity decays rapidly when the capsid is no longer closed (complete loss of GFP signal). In the presence of 500 nM LEN (C), the CypA paint signal remains constant even when the GFP signal is completely lost showing that the drug stabilises the ruptured capsid. (D) Analysis of the capsid lifetimes from all single-molecule GFP release traces in the field of view to yield capsid survival curves (including ‘opening’ and ‘closed’, excluding ‘leaky’). The faster decay in the presence of 500 nM LEN compared to no drug control shows that LEN induces rupture of the capsid. Data from a representative experiment (total number of traces): no drug (615); 500 nM LEN (281). (E, F) Analysis of all single-molecule CypA paint traces to yield heatmaps (magenta) and median traces (black line) of the CypA intensity measured at particles with leaky (left) or opening (right) capsids in the absence (E) or presence of 500 nM LEN (F). LEN prevents dissociation of CA from the lattice of capsids that are no longer closed cones. The number of HIV particles (N) for each condition is specified in the top left corner of the corresponding heatmap.

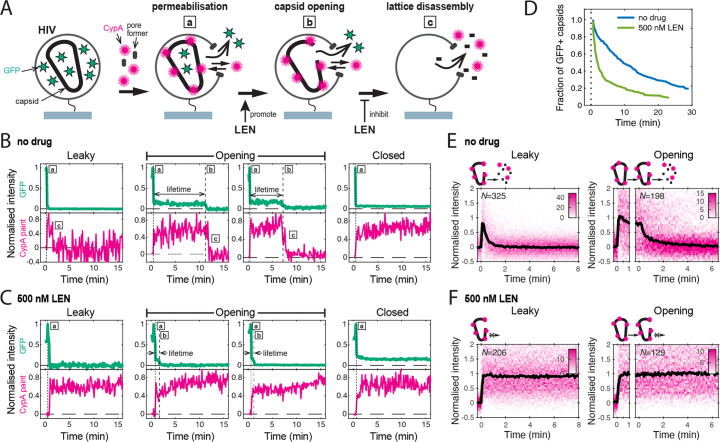
Figure 2.

Figure 2—figure supplement 1. Maturation of HIV produced with Gag-iGFP.

Figure 2—figure supplement 1.

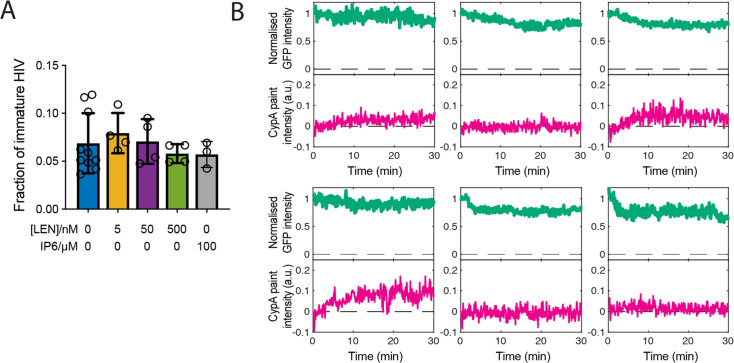
(A) Bar chart showing the fraction of immature particles determined by TIRF imaging in the absence or presence of LEN or IP6. As expected, the fraction of immature particles does not depend on addition of LEN or IP6 during the uncoating experiment. The bars show the mean and the error bars show the standard deviation determined from the following number of experiments: 10 (0 nM LEN), 4 (5 nM LEN), 4 (50 nM LEN), 4 (500 nM LEN) and 3 (100 µM IP6). (B) Representative single-molecule fluorescence traces characteristic of an immature Gag lattice. Unlike particles that have undergone proteolysis, immature particles release little or no GFP because it remains part of the Gag polyprotein anchored to the inside of the viral membrane. CypA binding to these particles is negligible or slow because the CypA loops are poorly accessible in the context of the immature Gag lattice. Particles identified as immature on the basis of these criteria are excluded from analysis since they do not contain a mature capsid.
Figure 2—figure supplement 2. Interpretation of TIRF uncoating data and limitations of the assay.

Figure 2—figure supplement 2.

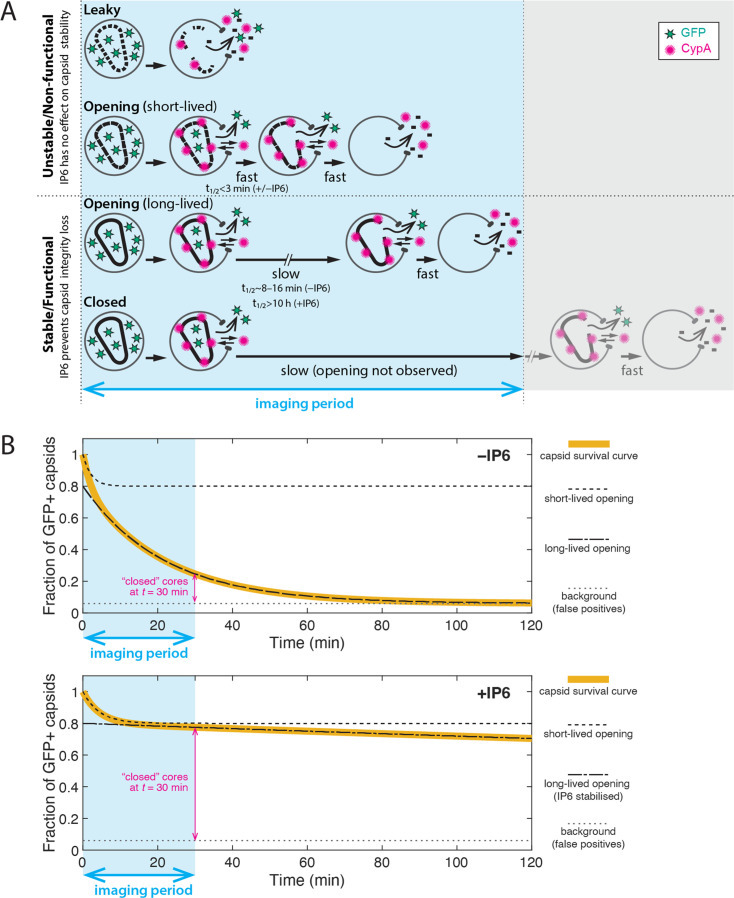
(A) Cartoon showing the different uncoating phenotypes observed in the dual colour (iGFP release and CypA paint) TIRF uncoating assay. Two broad stability types can be distinguished: (1) Unstable/non-functional capsids. ‘Leaky’ (total GFP release upon virion permeabilisation) and ‘opening–short-lived’ capsids (half-life of 1–2 min) are intrinsically unstable and cannot be rescued by IP6. These capsids are presumably incompletely or improperly assembled and non-functional. (2) Stable/functional capsids. The subpopulation of ‘opening–long-lived’ capsids (half-life of 8–16 min) can be stabilised by IP6, which keeps the closed cone intact by preventing loss of the first subunit(s), greatly increasing the half-life. Capsids that remain closed at the end of the experiment are presumed to have the same uncoating behaviour (i.e. are structurally and functionally the same) as ‘opening–long-lived’ capsids, whereby the imaging period was simply not long enough to observe the opening of all capsids in the field of view. Limitations of the TIRF uncoating assay: As with all imaging methodologies, the particle detection limit depends on factors that influence the signal-to-noise ratio (e.g. laser power, exposure time, penetration depth, imaging frequency, photophysical properties of the fluorophore). Known artefacts of iGFP: (1) Particles produced with iGFP have a broad distribution of GFP intensities, and dim particles with closed capsids that contain too little GFP can fall below the detection limit and thus appear as GFP-negative/CypA paint-positive spots. (2) A small proportion of GFP-positive spots persists throughout the experiment and remains negative for CypA paint. We attribute this background of false positives (typically <5% of the preparation) to particles containing residual uncleaved Gag-iGFP. Known artefacts of CypA paint: The efficiency of using CypA paint analysis to detect leaky capsids depends on the imaging frequency. This is because the CypA paint signal of leaky capsids is too short-lived (often appearing in only one frame or missed entirely when imaged at a low frequency) to be detected in a noisy baseline. For example, only ~20% of leaky capsids that are detected by GFP release are also detected by CypA paint at an imaging frequency of 1 frame every 6 s. (B) Idealised capsid survival curves in the absence (top) and presence (bottom) of IP6. Leaky particles are excluded from survival analysis. The survival curve (yellow line) is a convolution of the decay curves corresponding to the short- (dashed black line) and long-lived (dash-dotted black line) subpopulations. Only the long-lived subpopulation responds to IP6. The survival curve decays to a background level above zero (dotted grey line) that is presumably due to false positive signals. Parameter values used for calculating the traces: Fractions of short-lived/long-lived/background particles are 20%/74%/6%, respectively. The half-lifes for the curves in the absence of IP6 are t1/2short=1.5 min and t1/2long=15 min. The half-lifes for the curves in the presence of IP6 are t1/2short=3 min and t1/2long=10 h.
Figure 2—figure supplement 3. The pore-forming protein SLO does not affect capsid stability.

Figure 2—figure supplement 3.

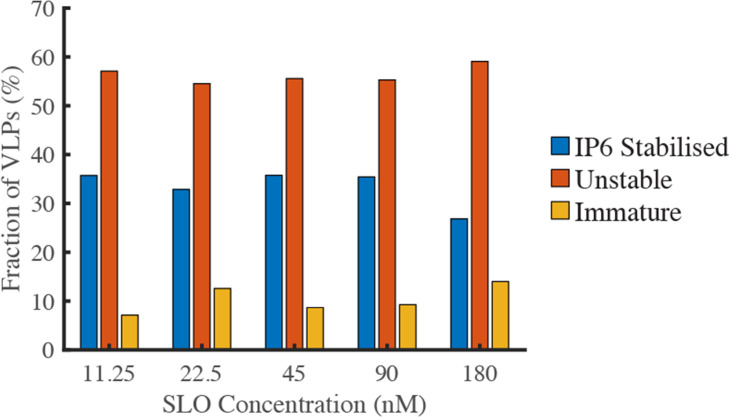
GFP-loaded HIV particles produced with Gag-iGFP were captured onto the surface of a glass coverslip and imaged by TIRF microscopy while flowing a solution containing the pore-forming protein SLO (to permeabilise the viral membrane) and IP6 (to prevent uncoating of stable capsids). The fractions of particles with IP6-stabilised capsids (retaining a low intensity signal corresponding to encapsidated GFP), particles with unstable capsids (complete loss of GFP intensity) and immature particles (high intensity signal due to unprocessed Gag-iGFP) was independent of the SLO concentration between 11.25 and 180 nM.