. 2024 Feb 13;13:e83605. doi: 10.7554/eLife.83605

Figure 3. LEN accelerates capsid opening and subsequently prevents CA lattice disassembly.

Single-molecule analysis of the effect of 0–500 nM LEN −/+100 µM IP6 on capsid uncoating via GFP release and CypA paint. (A) Capsid survival curves showing that the drug induces rupture of the capsid. Pooled data from multiple experiments (total number of traces/number of experiments): 0 nM (4325/10); 0.5 nM (1242/4); 5 nM (1585/4); 50 nM (1520/5); 500 nM (1048/4). (B) Capsid survival curves showing that IP6 inhibits capsid opening in the absence of LEN and partially counteracts the drug-induced rupture of the capsid at low but not high concentrations of LEN. Pooled data from multiple experiments (total number of traces/number of experiments): 0 nM LEN +IP6 (836/3); 5 nM LEN +IP6 (589/2); 50 nM LEN +IP6 (321/1); 500 nM LEN +IP6 (238/1). (C) Fraction of closed (GFP-positive) capsids at t=15 minutes of the uncoating experiments shown in A and B. (D) Heatmaps (magenta) and median traces (black line) of the CypA intensity measured at particles with leaky or opening capsids in the presence of 0–500 nM LEN showing that LEN stabilises the CA lattice of ruptured capsids above an occupancy (θ) threshold of ~30–66%. The occupancy at the time of membrane permeabilisation was calculated as described in Figure 4—figure supplement 1. (E) Heatmap (magenta) and median trace (black line) of the CypA intensity of particles (leaky/opening) showing that 500 nM LEN prevents CA loss from the ruptured capsid for at least 5 hr. The number of HIV particles (N) for each condition in D and E is specified above the corresponding heatmap.

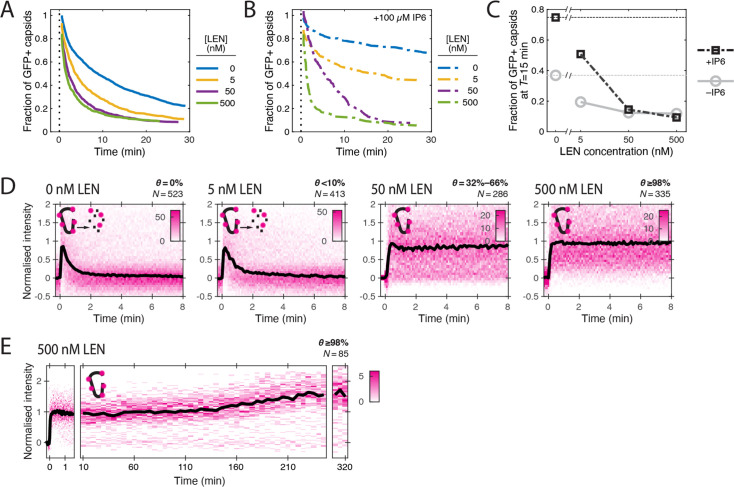
Figure 3.

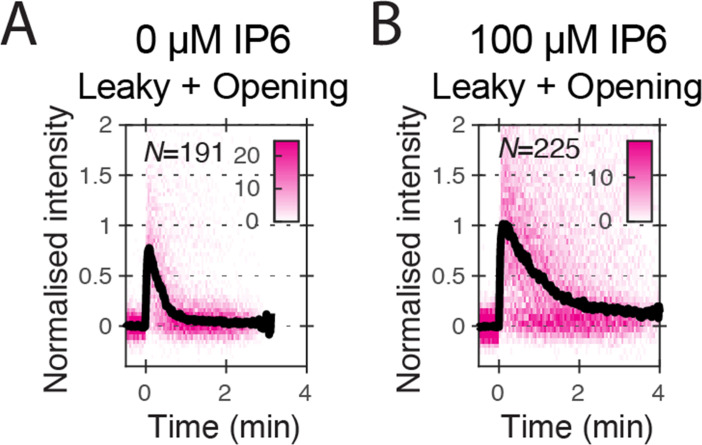
Figure 3—figure supplement 1. Heatmaps (magenta) and median traces (black line) of the CypA intensity measured at particles with leaky or opening capsids in the absence (A) or presence (B) of 100 μM IP6.

Figure 3—figure supplement 1.

The number of HIV particles (N) for each condition is specified in the top left corner of the corresponding heatmap.
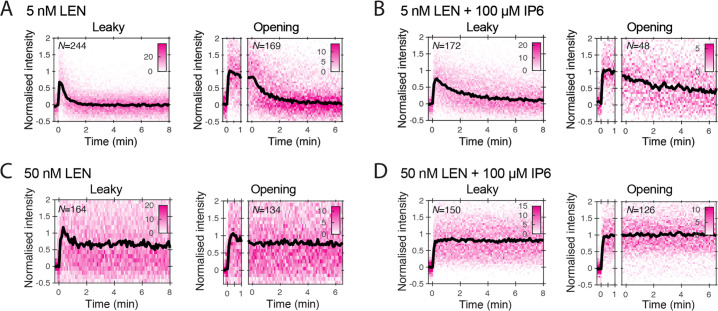
Figure 3—figure supplement 2. Heatmaps (magenta) and median traces (black line) of the CypA intensity measured at particles with leaky (left) or opening (right) capsids.

Figure 3—figure supplement 2.

(A, B) 5 nM LEN in the absence (A) or presence (B) of 100 μM IP6. The presence of IP6 slows capsid disassembly in the presence of 5 nM LEN but does not prevent it. (C, D) 50 nM LEN in the absence (C) or presence (D) of 100 μM IP6. 50 nM LEN stabilises the CypA paint signal, regardless of whether IP6 is present. The number of HIV particles (N) for each condition is specified in the top left corner of the corresponding heatmap.
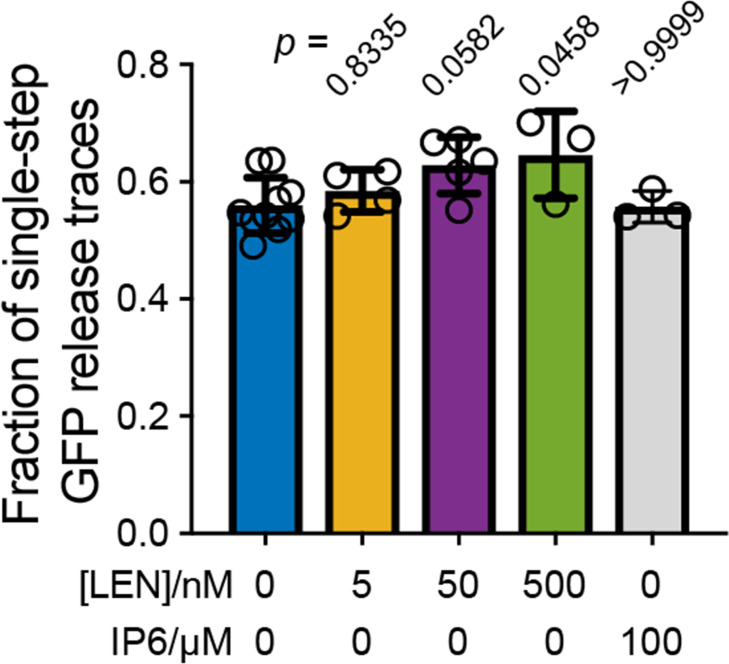
Figure 3—figure supplement 3. Effect of LEN on the fraction of particles that release their total GFP content in a single step.

Figure 3—figure supplement 3.

Single-step GFP release traces in the absence of LEN are attributed to ‘leaky’ capsids that cannot retain GFP upon membrane permeabilisation. This leaky fraction is 56 ± 5% for virions analysed in Figures 2 and 3. Addition of LEN during the uncoating experiment causes a concentration-dependent increase in the fraction of single-step GFP release traces (reaching 65 ± 5% at 500 nM LEN), whereby we attribute the increase to rapid LEN-induced rupture of intact capsids (too fast to be resolved as a separate step in the uncoating traces recorded with a frame rate of 1 frame every 6 s). As expected, IP6 does not affect the ‘leaky’ fraction because IP6 stabilises closed cones but is unable to prevent disassembly of CA lattices with open edges. Bar charts show the mean and error bars show the standard deviation from the following number of experiments: 10 (0 nM LEN), 4 (5 nM LEN), 5 (50 nM LEN), 3 (500 nM LEN) and 3 (100 µM IP6). Statistical comparisons using one-way ANOVA with Dunnett’s multiple comparison test. The p values of the comparison between control (0 nM LEN) and different LEN concentrations are given above the corresponding bars.