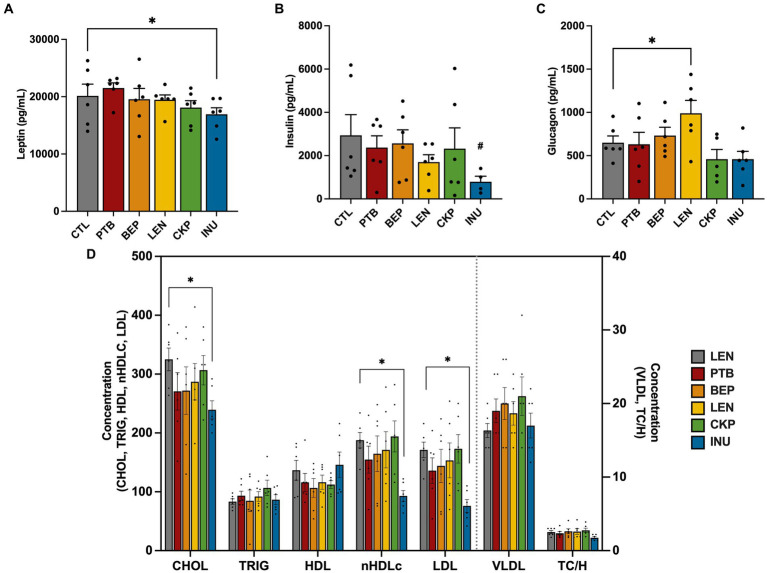
Figure 4.
Influence of RS and inulin supplementation on the regulation of endocrine response and lipid profiles in serum. (A) Leptin levels, (B) Insulin levels, (C) Glucagon levels, and (D) Lipid profiles. CTL, control group; PTB, pinto beans; BEP, black-eyed-peas; LEN, lentils; CKP, chickpeas; INU, inulin. Data includes both genders; pairwise comparisons adjusted for sex. *p < 0.05, #p < 0.10.

