Figure 2.
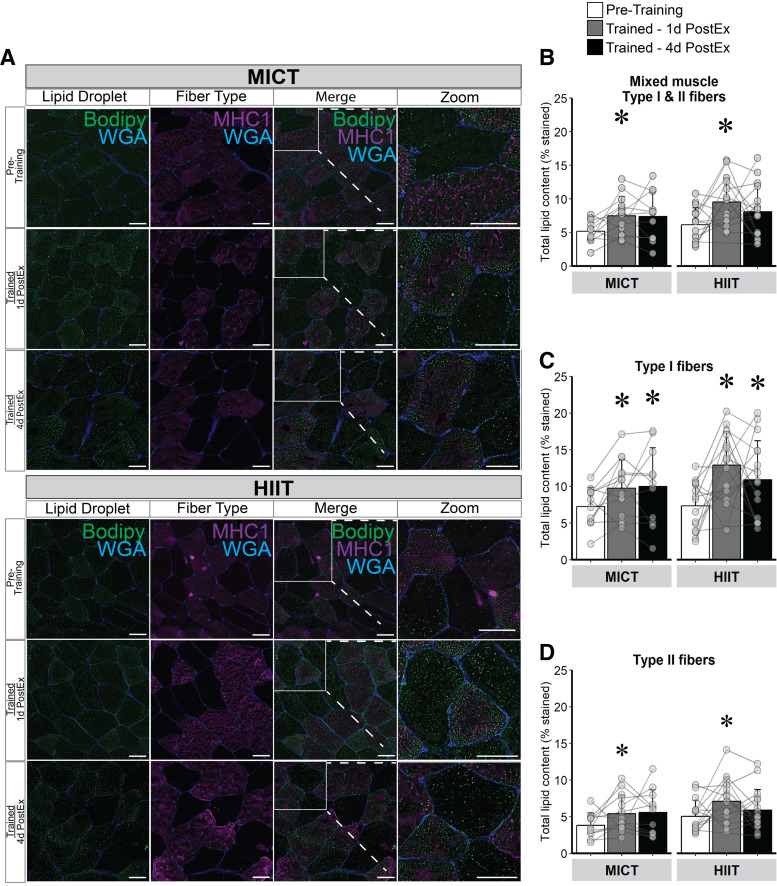
Lipid content in mixed skeletal muscle, type I, and II muscle fibers in response to training. A: representative image: samples were stained with bodipy 493/503 (LD, green), myofiber stain for myosin heavy chain I (MHC1; type I fibers, purple) and wheat germ agglutinin (WGA; membranes, blue). The regions inside the white boxes are enlarged for a clearer view. Representative images for each time point were obtained from the same participant in each group. Magnification, ×20. Scale bar, 100 µm for all images. B: lipid content represented as % stained in mixed skeletal muscle (type I and II fibers). C: lipid content in type I muscle fibers (MHC1+). D: lipid content in type II muscle fibers (MHC1−). MICT, n = 14; HIIT, n = 17. *Main effect for visit (P < 0.05) and post hoc analysis identifying significant difference from pretraining. Data are expressed as means ± SD. HIIT, high-intensity interval training; LD, lipid droplet; MICT, moderate-intensity continuous training.

