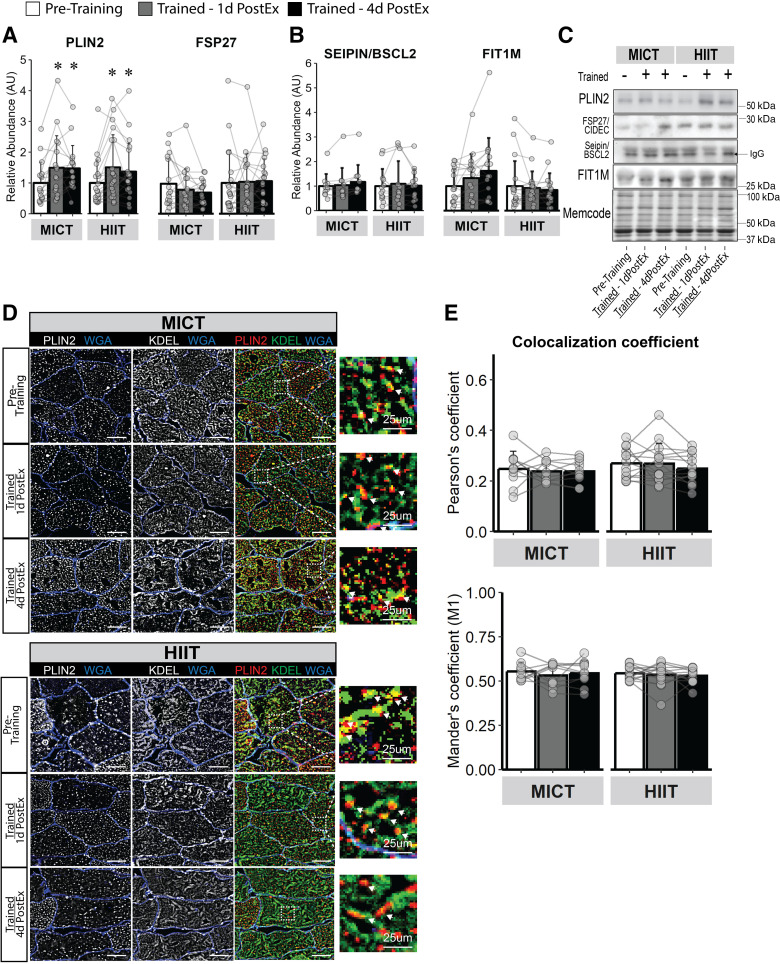
Figure 4.
Skeletal muscle LD abundance and de novo LD biogenesis activity in response to training. Immunoblots for proteins corresponding to triacylglycerol storage and release localized to the LD membrane (PLIN2 and FSP27; A) and LD stabilization localized to the ER (Seipin/BSCL2 and FIT1M; B). C: representative images for immunoblots in A and B. D: representative immunofluorescence images for LD (PLIN2, red) colocalization with the ER (KDEL, green) as a measure of de novo LD biogenesis from the ER. Membranes are stained blue. Magnification, ×40. Scale bar, 100 µm for standard images and 25 µm for zoomed images. White arrows from zoom represent colocalization event. E: LD-ER colocalization measured by Pearson’s and Mander’s (M1) coefficient. MICT, n = 11; HIIT, n = 13. *Main effect for visit (P < 0.05) and post hoc analysis identifying significant difference from pretraining. Data are expressed as means ± SD. ER, endoplasmic reticulum; HIIT, high-intensity interval training; LD, lipid droplet; MICT, moderate-intensity continuous training.

