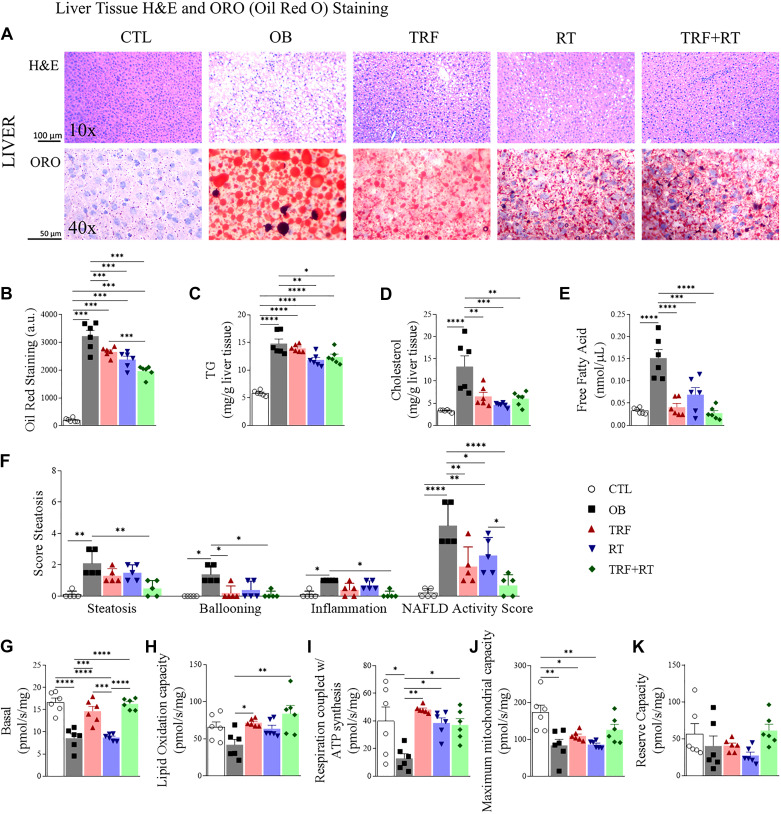
Figure 5.
Lipid profile and mitochondrial respiration in the liver. The histological plate of liver tissue stained with hematoxylin-eosin (H&E) and Oil Red (A); quantification of the area stained with Oil Red (n = 6 animals) (B); hepatic triglycerides (TG, n = 6 animals) (C); hepatic cholesterol (n = 6 animals) (D); quantification of free fatty acids (n = 6 animals) (E); the analysis of nonalcoholic fatty liver disease (NAFLD) Activity Score (n = 5 animals) (F); basal mitochondrial respiration (n = 6 animals) (G); lipid oxidation capacity (n = 6 animals) (H); respiration coupled with ATP synthesis (n = 6 animals) (I); maximum mitochondrial capacity (n = 6 animals) (J); reserve capacity (n = 6 animals) (K). Bars represent means ± SD, *P < 0.05, **P < 0.01, ***P < 0.001, and ****P < 0.0001. CTL, control group; OB, obese; RT, resistance exercise training; TRF, time-restricted feeding.

