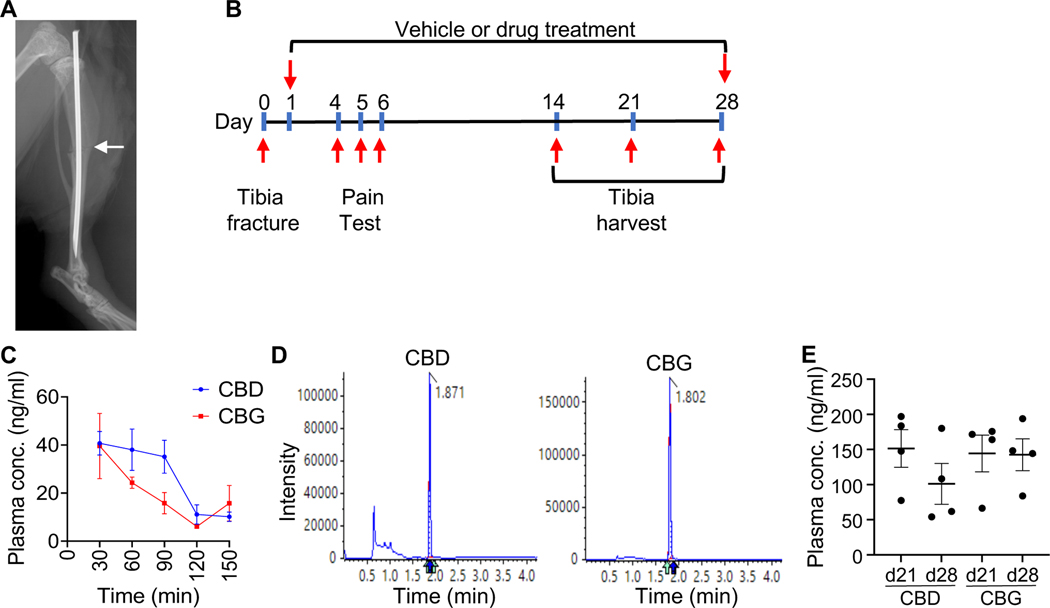
Figure 1. Measuring the plasma concentration of CBD and CBG following acute and chronic administration.
(A) An X-ray image captured post-operatively. The image shows the fracture line (white arrow) and the intramedullary nail that was used to stabilize the fracture. (B) A schematic of the experimental timeline. (C) The plasma concentrations (ng/ml) of CBD (blue) and CBG (red) measured at the indicated timepoints following administration of the first dose. The analysis was performed using liquid chromatography coupled with tandem mass spectrometry (LC-MS-MS). N = 4. The line presents average ± SEM. (D) Representative mass spectra that show the analysis of CBD (left) or CBG (right) in plasma samples. The retention time of each compound is indicated. (E) As in (C), except that the concentration of CBD and CBG were measured following daily administration of each drug for 21 or 28 days (d21 and d28 samples, respectively).

