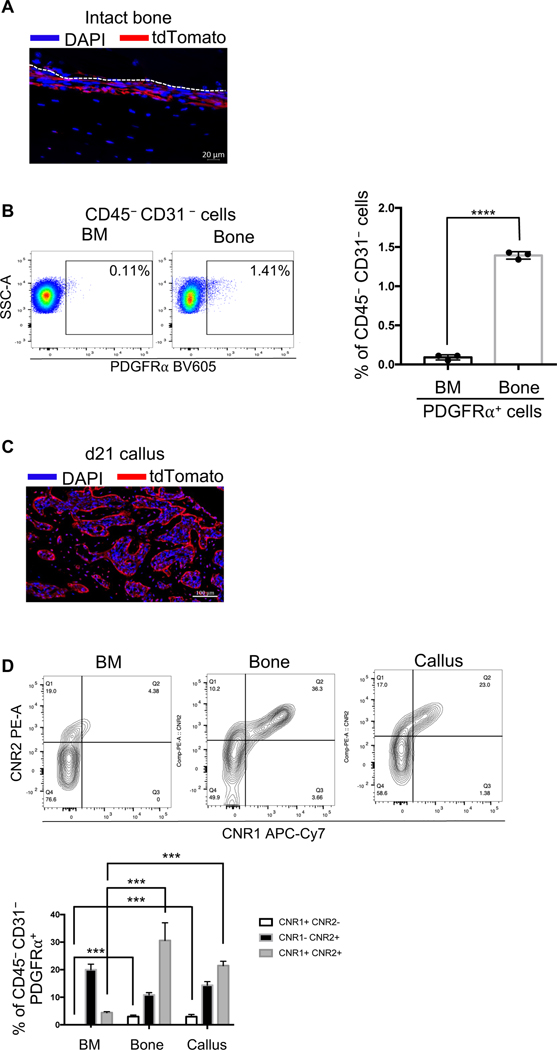
Figure 8. Differential expression of CNR1 and CNR2 in subpopulations of the PDGFRα+ progenitors.
(A) The PDGFRαAi9 mice were injected with 100 mg/kg of tamoxifen for 5 consecutive days. The intact bone was then harvested, and IF microscopy was used to detect the tdTomato reporter activity (red). DAPI (blue) stains nuclei. The scale bar = 20 μm. (B, left) A representative dot plot of the FC results, showing the abundance of PDGFRα+ progenitors (i.e., CD45–CD31– PDGFRα+ cells) in the BM and intact bone. The % of PDGFRα+ cells relative to the CD45–CD31– (nonhematopoietic and nonendothelial) population in each tissue is shown. (B, right) Quantification of the relative proportion of PDGFRα+ progenitors in the BM vs intact bone. (C) The PDGFRαAi9 mice were injected with tamoxifen as in (A), fractured, and the fracture callus was harvested on d21 post-fracture. IF microscopy was used to detect the tdTomato reporter activity (red) in the callus. DAPI (blue) stains nuclei. The scale bar = 100 μm. (D, top) As in (B), except that the expression of CNR1 and CNR2 in the PDGFRα+ progenitors (CD45–CD31– PDGFRα+) was analyzed. (D, bottom) As in (B, right), except that the proportion (%) of each of the indicated subpopulations of the PDGFRα+ progenitors was quantified.
The IF images are representative of N = 3. For FC analysis, N = 3, and 4 calli were pooled in each. The bar graphs present average ± SEM. (***) P < 0.001, (****) P < 0.0001. Student’s t test was used in (B), and one-way ANOVA (followed by Tukey’s post hoc test) was used in (D) to compare the abundance of each population among the 3 tissues.

