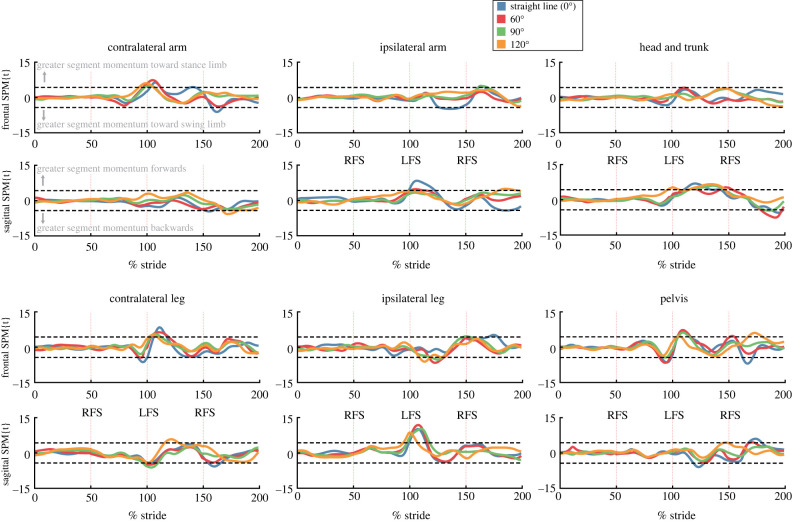
Figure 8.
SPM{t} statistic comparing time-normalized segment angular momenta for uninhibited and inhibited step turns. For each segment, the top plot is the time series of the SPM{t} in the frontal plane while the bottom plot displays the SPM{t} in the sagittal plane. Two strides surrounding the inhibited step are presented, with the foot strike of the inhibited step always occuring at 100% of the stride cycle. Vertical dashed lines indicate foot strikes. Significant differences between uninhibited and inhibited trials (α = 0.001) occurred when the t-statistic crossed either of the horizontal dashed lines. Data presented in this figure are only for trials where participants accurately stepped on the first recovery target. Vertical dashed lines display foot strike events and are labelled for left foot strikes (LFS) and right foot strikes (RFS).

