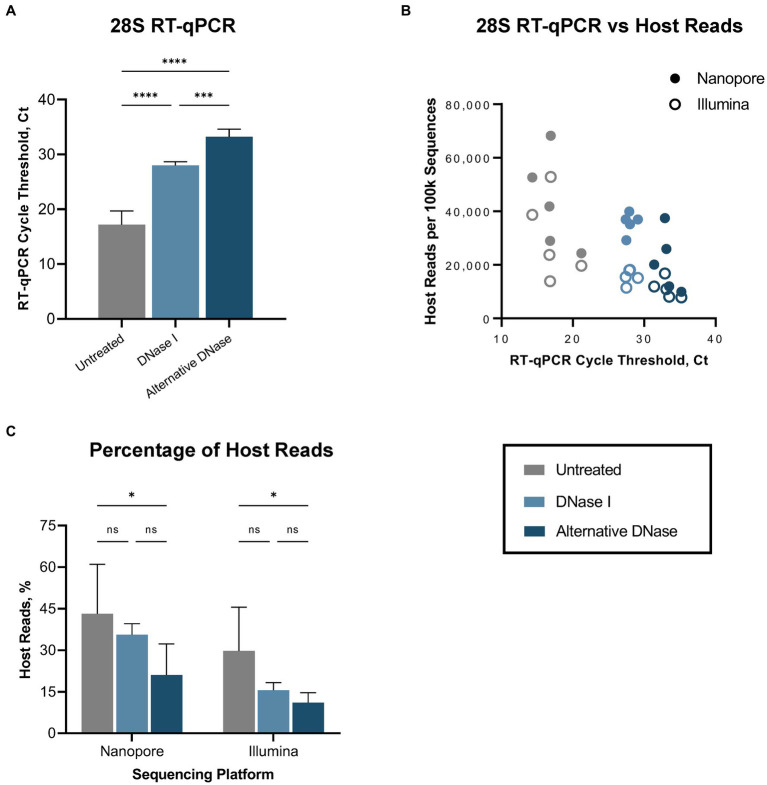
Figure 2.
Host (Gallus gallus) reads depletion outcome. (A) Average cycle threshold (Ct) values of 28S rRNA RT-qPCR assay in different depletion methods. (B) Relationship between 28S rRNA RT-qPCR Ct values and number of sequenced host-specific reads. (C) The average percentage of reads mapping to the host genome in different depletion treatments obtained on Nanopore and Illumina sequencing platforms. One-way ANOVA with Tukey’s multiple comparison analysis was used to evaluate the significance between different depletion methods. A value of p < 0.05 was considered to be significant. *p < 0.05; **p < 0.01; ***p < 0.001; ****p < 0.0001.

