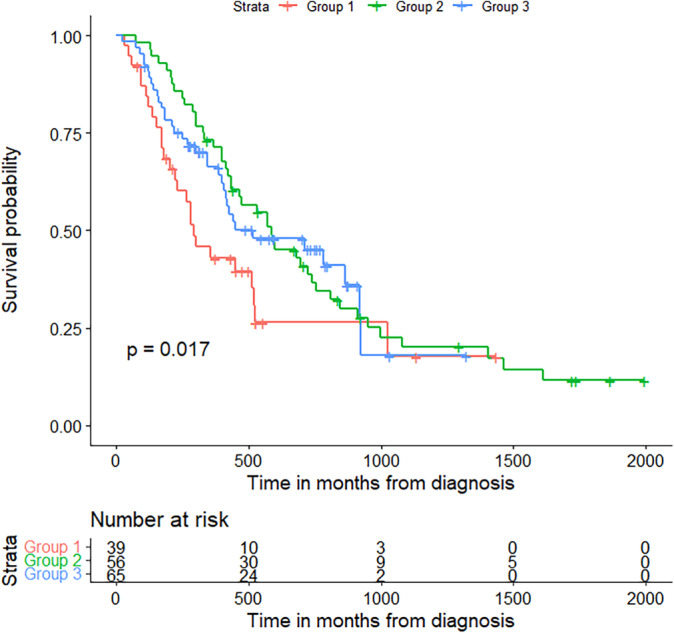
FIGURE 2.

Overall survival of each treatment group from time of diagnosis. Overall survival of ChemoImmuno1 (blue), Chemo1 (red), and Immuno1 (green) groups from the time of diagnosis. Survival was similar between the three groups, with a trend for worse early survival in the ChemoImmuno1 group.
