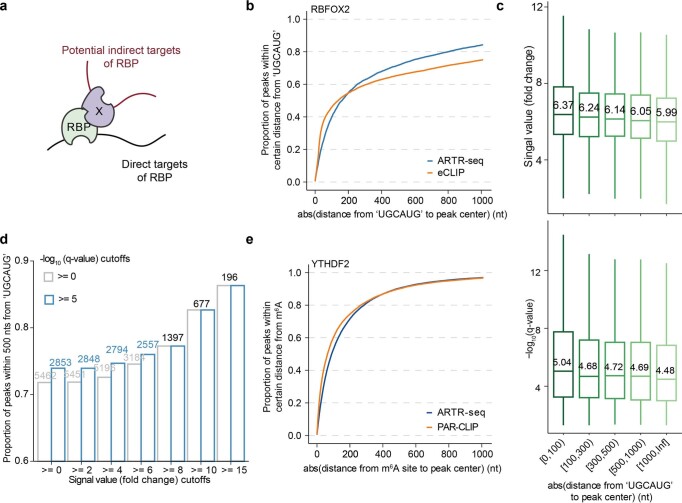
Extended Data Fig. 4. The direct versus indirect binding in ARTR-seq.
a, A schematic diagram illustrating the simplified direct and indirect targets of the RNA binding protein (RBP). The symbol “X” represents the interacting protein or complex of the RBP. b, Cumulative curves displaying the proportion of RBFOX2 peaks with peak centers located within a certain absolute distance on the genome from the nearest RBFOX2 canonical motif ‘UGCAUG’ for both ARTR-seq and eCLIP28 (ENCODE: ENCFF871NYM). c, Boxplots showing ARTR-seq peaks exhibiting reduced signal values (top) and q-values (bottom) as the absolute distance to the nearest ‘UGCAUG’ site increases. From left to right, n = 2164, 1263, 489, 677 and 869. d, A bar plot illustrating the impact of signal value cutoffs and q-value cutoffs on the proportion of RBFOX2 peaks within an absolute distance of 500 nts from the closest RBFOX2 canonical motif ‘UGCAUG’. The number of remaining peaks was labeled at the top of the bar after applying the cutoffs. e, Cumulative curves exhibiting the proportion of YTHDF2 peaks with peak centers located within a certain absolute distance on the transcriptome from the nearest m6A sites identified by m6A-SAC-seq33 for both ARTR-seq and PAR-CLIP32.

