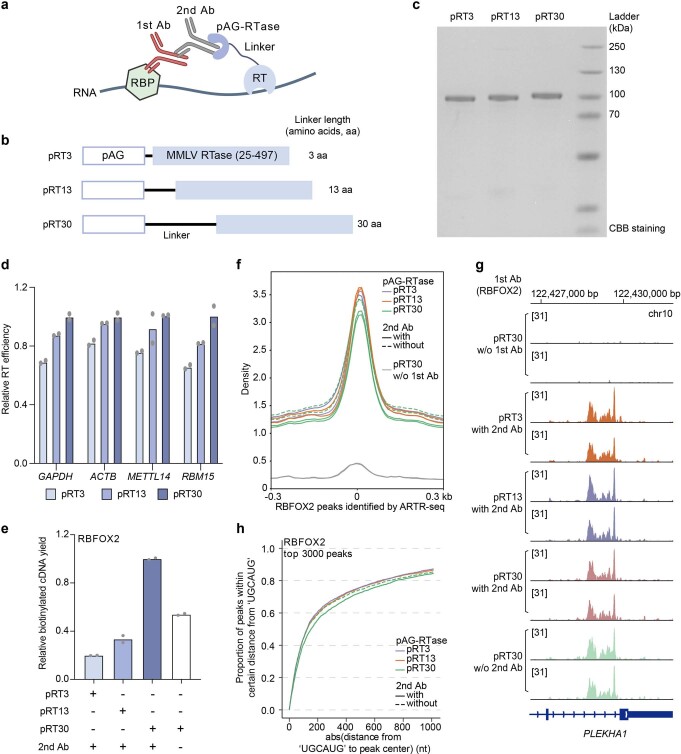
Extended Data Fig. 5. Optimizations for reducing potential indirect binding in ARTR-seq.
a, A schematic diagram demonstrating the binding of protein A/G-reverse transcriptase (pAG-RTase), secondary antibody (2nd Ab), and the primary antibody (1st Ab). b, A schematic diagram showing the constructs of pAG-RTases with different amino acid (aa) linker lengths: 3 aa for pRT3, 13 aa for pRT13, and 30 aa for pRT30. c, Coomassie bright blue staining of the purified pRT3, pRT13 and pRT30. d, qRT-PCR analysis for GAPDH, ACTB, METTL14 and RBM15 showing the in-vitro RT efficiency of pAG-RTases with different linker lengths. n = 2 biological replicates. e, qPCR analysis to quantify relative cDNA yields of RBFOX2 ARTR-seq samples. n = 2 biological replicates. f, Signal profiles of ARTR-seq read density at RBFOX2 ARTR-seq peaks and flanking 0.3 kb. g, A snapshot from IGV showing signals of ARTR-seq libraries. h, Cumulative curves displaying the proportion of the top 3000 RBFOX2 peaks (with the highest signal values) with peak centers located within a certain absolute distance from the nearest ‘UGCAUG’ for ARTR-seq libraries constructed under different conditions.

