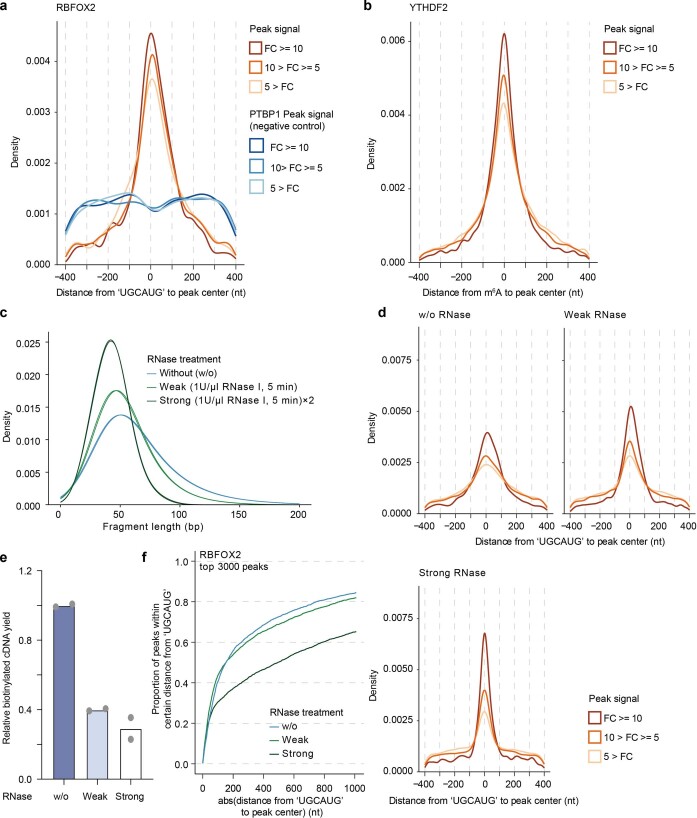
Extended Data Fig. 6. The resolution of ARTR-seq.
a, Density plots showing the distribution of peak centers within a 400-nt window in genome flanking the RBFOX2 canonical binding motif ‘UGCAUG’ for RBFOX2 and PTBP1 (negative control) ARTR-seq libraries. b, Density plots showing the distribution of peak centers within a 400-nt window in transcriptome flanking m6A sites in HeLa cells identified by m6A-SAC-seq33 for the YTHDF2 ARTR-seq libraries. The distributions in a,b are split into three groups based on the peak signal values. c, Density plots exhibiting the distribution of fragment length for ARTR-seq libraries with or without RNase treatment. d, Density plots showing the distribution of RBFOX2 peak centers within a 400-nt window flanking the RBFOX2 canonical binding motif ‘UGCAUG’ for ARTR-seq libraries without RNase treatment, with weak RNase I treatment and with strong RNase I treatment. The distribution is split into three groups based on the peak signal values. e, qPCR analysis to quantify the relative cDNA yields of ARTR-seq. n = 2 biological replicates. f, Cumulative curves displaying the proportion of the top 3000 RBFOX2 peaks (with the highest signal values) with peak centers located within a certain absolute distance from the nearest ‘UGCAUG’ for ARTR-seq libraries constructed with or without RNase treatment.

