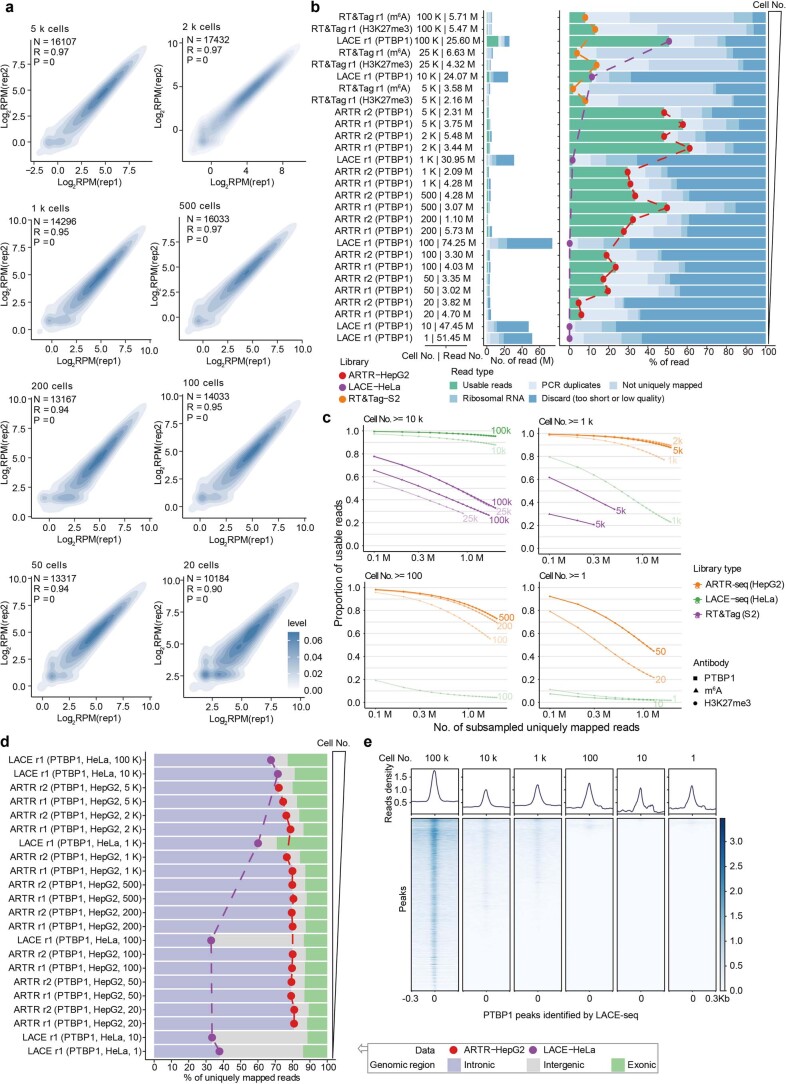
Extended Data Fig. 7. Application of ARTR-seq using low input samples.
a, ARTR-seq replicate correlations for usable reads per gene normalized to coverage (RPM) for PTBP1 with different numbers of HepG2 cells. The color scale shows the point density. The coefficient R and P-values were given by the two-tailed Pearson’s correlation. b, Bar plots showing numbers (left) and percentages (right) of the usable reads and reads filtered after each processing step for libraries constructed from different cell numbers by ARTR-seq, LACE-seq13, and RT&Tag22. The libraries generated by the same method are linked with the line and indicated in the same color. c, Percentages of usable reads in subsampled uniquely mapped reads from PTBP1 libraries constructed from different numbers of cells by ARTR-seq, LACE-seq13, and RT&Tag22, respectively. Different methods are indicated by colors. d, A bar plot showing the usable reads distribution in the intronic (purple), intergenic (grey) and exonic (green) regions of libraries constructed from different numbers of cells by ARTR-seq and LACE-seq, respectively13. The libraries generated by the same method are linked with the line and indicated with the same color. e, The signal profile and heatmap of read density in LACE-seq with different numbers of cells at LACE-seq-identified PTBP1 peaks13.

