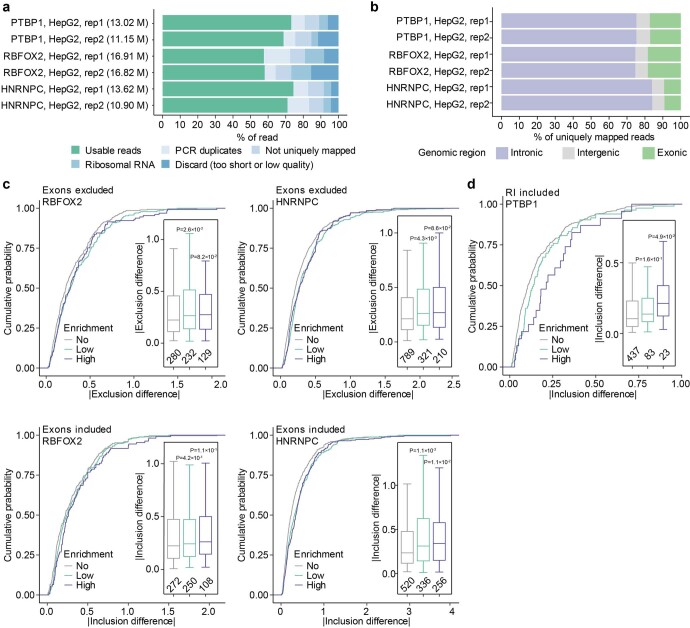
Extended Data Fig. 8. ARTR-seq-detected binding signals of splicing factors.
a, Bar plots showing numbers (left) and percentages (right) of the usable reads and reads filtered in each processing step for ARTR-seq libraries of PTBP1, RBFOX2 and HNRNPC. b, A bar plot showing the usable reads distribution in the intronic (purple), intergenic (grey) and exonic (green) regions for ARTR-seq libraries of PTBP1, RBFOX2 and HNRNPC. c, Cumulative curves and boxplots (inside) showing the absolute value of splicing difference upon RBFOX2 (left) or HNRNPC (right) knockdown. d, Cumulative curves and boxplots (inside) showing the absolute value of splicing differences of included RI upon PTBP1 knockdown. In c,d, RBP-regulated genes were divided into three groups according to their enrichment in ARTR-seq, including no enrichment (No, 0 ≤ enrichment ≤ 1), low enrichment (Low, 1 < enrichment ≤ 2) and high enrichment (High, 2 < enrichment). The sample size in c,d was indicated below the respective box. P-values in c,d were determined using the two-tailed Student’s t-test of indicated group versus ‘no enrichment’ group.

