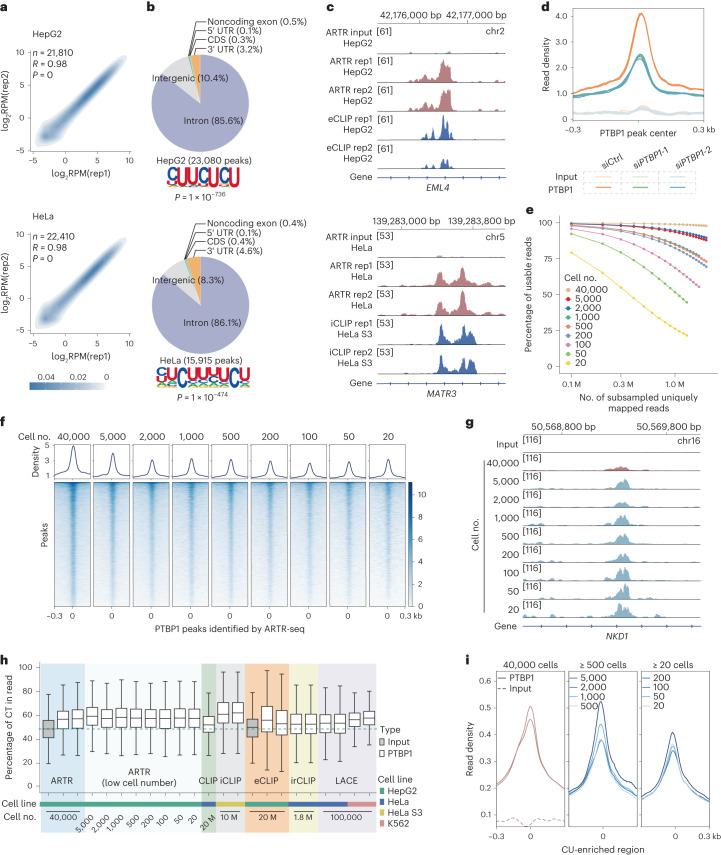
Fig. 2. ARTR-seq captures binding sites of RBPs using as few as 20 cells.
a, ARTR-seq replicate correlations for usable reads per gene normalized to coverage (reads per million reads mapped, RPM) for PTBP1 in HepG2 (top) and HeLa (bottom) cells, respectively. Usable reads were the remaining genomic uniquely mapped reads after deduplication. The color scale shows the point density. The coefficient R and P values were given by the two-tailed Pearson’s correlation. b, Peaks distribution in 3′ UTR, CDS, 5′ UTR, noncoding exon, intergenic region and intron, and the corresponding motifs of PTBP1 binding peaks identified by ARTR-seq in the HepG2 (top) and HeLa (bottom) cells, respectively. P values were calculated by the two-tailed binomial test in the HOMER suite52. c, Snapshots from the IGV showing the signal overlaps between ARTR-seq and eCLIP28 (top) or iCLIP27 (bottom). The ARTR-seq input was pooled by three biological replicates. d, ARTR-seq read density at PTBP1 binding peaks of control (siCtrl) and PTBP1 knockdown (siPTBP1) HepG2 cells revealed by ATAR-seq. e, Percentages of usable reads in subsampled uniquely mapped reads from PTBP1 ARTR-seq with different numbers of cells. The plot shows replicate 1 for simplicity. f, Signal profiles and heatmaps of read density in ARTR-seq libraries constructed from 20 to 40,000 HepG2 cells at ARTR-seq-identified PTBP1 peaks. g, A snapshot from IGV showing the stable ARTR-seq signal in sequencing libraries constructed from different numbers of HepG2 cells. h, A box plot comparing the CT percentages of usable reads from libraries constructed by using ARTR-seq, CLIP26, iCLIP27, eCLIP28, irCLIP10 and LACE-seq13, respectively. The green dashed line represents the median percentage in the ARTR-seq input library. The sample sizes are summarized in Supplementary Table 3. i, Signal profiles of ARTR-seq read density at CU-enriched regions. CU-enriched regions are defined as 80 nt-wide regions with a percentage of CT content greater than 70% located in the protein-coding genes.

