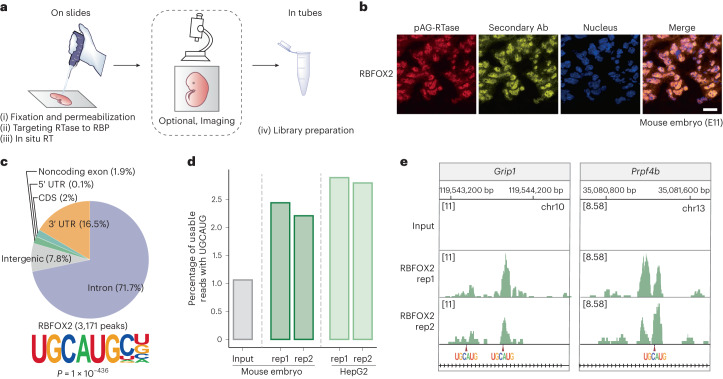
Fig. 3. ARTR-seq maps RBP binding sites in tissues.
a, ARTR-seq scheme for tissue samples. A section of tissue is fixed on the slide for ARTR-seq. The RTase is attached to the RBP of interest by specific antibodies and a protein A/G fusion, followed by in situ RT, with a built-in optional imaging step. The cDNA product is then collected for library preparation. b, Immunofluorescence imaging showing the localization of pAG-RTase (red), secondary Ab (yellow) and nucleus (blue) in the mouse embryo section (E11). Scale bar, 20 μm. c, Peaks distribution (top) in 3′ UTR, CDS, 5′ UTR, noncoding exon, intergenic region and intron, and motifs (bottom) of RBFOX2 binding peaks identified by ARTR-seq in the mouse embryonic tissue. P value was calculated by the two-tailed binomial test in the HOMER suite52. d, A bar plot showing the percentage of usable reads containing the RBFOX2 canonical UGCAUG motif for mouse embryos and HepG2 cells. e, Snapshots from IGV showing overlap of RBFOX2 ARTR-seq signal in mouse embryos with UGCAUG-containing sequences. The positions of the UGCAUG motifs are indicated with arrows.

