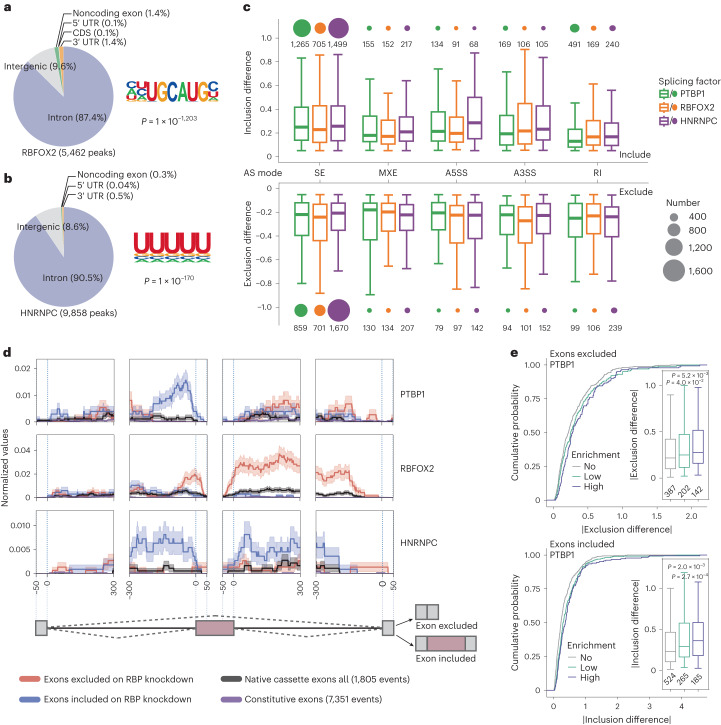
Fig. 4. RNA binding by splicing factors identified in ARTR-seq.
a,b, Peaks distribution (right) in 3′ UTR, CDS, 5′ UTR, noncoding exon, intergenic region and intron, and the corresponding motifs (left) of RBFOX2 (a) and HNRNPC (b) peaks detected by ARTR-seq in HepG2 cells. P values were calculated by the two-tailed binomial test in the HOMER suite52. c, Boxplots showing the splicing differences of five alternative splicing (AS) modes upon the knockdown of PTBP1 (green), RBFOX2 (orange) and HNRNPC (purple). The splicing modes include skipped exon (SE), mutually exclusive exon (MXE), alternative 5′ splice site (A5SS), alternative 3′ splice site (A3SS) and retained intron (RI). The size of circles on the top or bottom of each bar indicates event numbers. d, Normalized splicing maps37 showing the peak density for skipped exons that were excluded (red) or included (blue) upon corresponding splicing factor knockdown. Lines depict average ARTR-seq peak density. The confidence bounds show the standard errors of the alternatively included or excluded events. e, Cumulative curves and boxplots (inset) showing the absolute value of exon splicing differences upon PTBP1 knockdown. PTBP1-regulated genes were divided into three groups according to their enrichment in ARTR-seq, including no enrichment (No, 0 ≤ enrichment ≤ 1), low enrichment (Low, 1 < enrichment ≤ 2) and high enrichment (High, 2 < enrichment). The sample size was labeled below the respective box. P values were determined by the two-tailed Student’s t-test of the indicated group versus the ‘no enrichment’ group.

